
Figure 1.
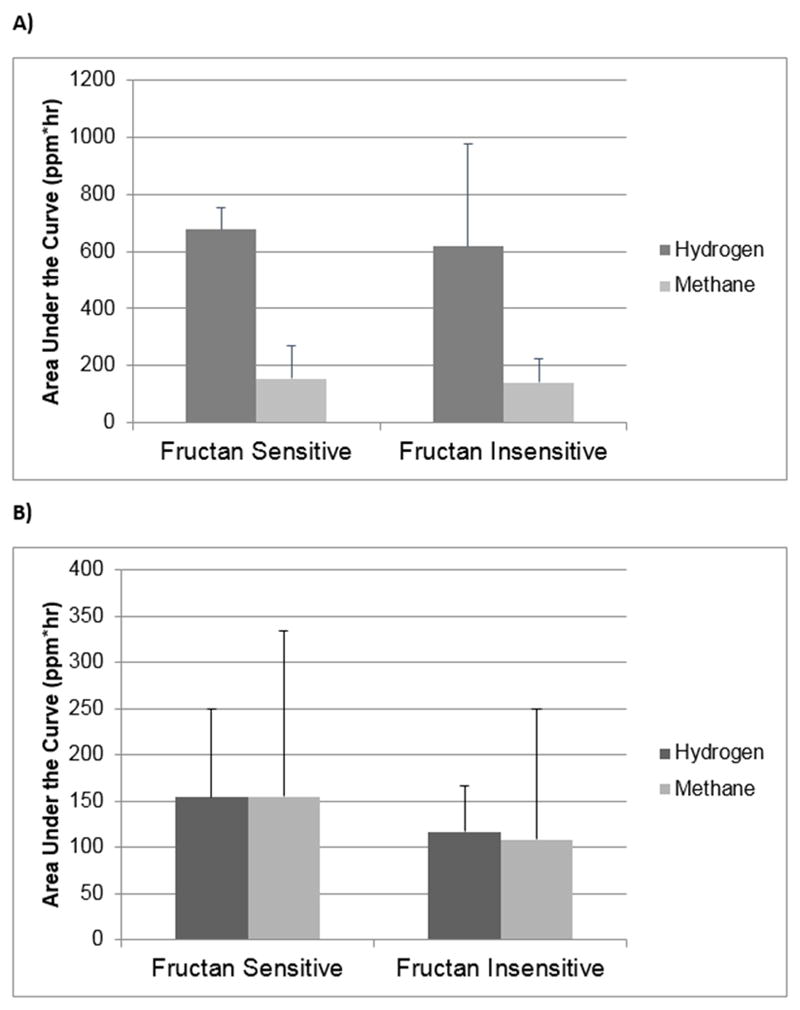
Hydrogen and Methane Gas Production in Children who were Fructan Sensitive vs. Fructan Insensitive Following A) Fructan Ingestion and B) Maltodextrin Ingestion. Data are presented as mean ± standard deviation.
Official websites use .gov
A
.gov website belongs to an official
government organization in the United States.
Secure .gov websites use HTTPS
A lock (
) or https:// means you've safely
connected to the .gov website. Share sensitive
information only on official, secure websites.
Hydrogen and Methane Gas Production in Children who were Fructan Sensitive vs. Fructan Insensitive Following A) Fructan Ingestion and B) Maltodextrin Ingestion. Data are presented as mean ± standard deviation.