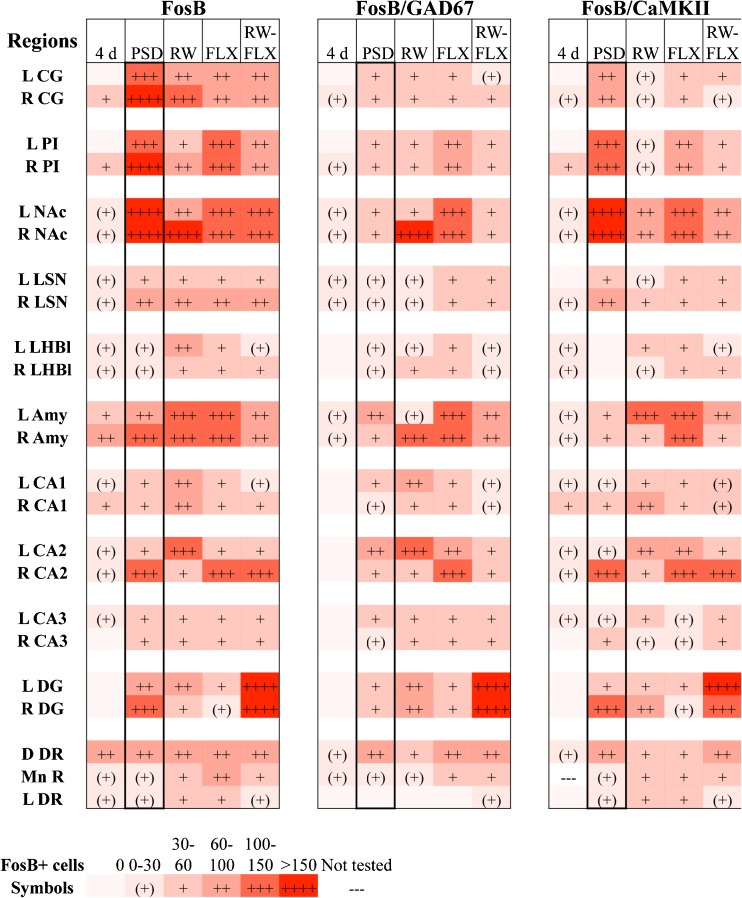
Fig. 7.
Heat map of chronic treatment-induced changes in FosB+ cells and cell types in poststroke depression (PSD) mice. Data on the number of FosB+ cells from Fig. S1 were plotted as a heat map with cell count ranges shown in the legend below. The cell counts are based on the number of total FosB, FosB/GAD67, or FosB/CAMKII (VGluT3 for raphe) stained cells from PSD mice at 4 days poststroke (4 d) or at 6 weeks poststroke after treatments: control (vehicle/fixed wheel, PSD) fluoxetine/fixed wheel (FLX), running wheel (RW), or combination FLX and RW (FLX-RW). Shown are left (L) and right (R): CG = cingulate gyrus; PI = pre-/infralimbic cortex; NAc = nucleus accumbens; LSN = lateral septum; LHBl = lateral habenula; Amy = amygdala; hippocampal CA1, CA2, CA3; DG = dentate gyrus; D DR = dorsal raphe, dorsal; L DR = lateral wings; Mn R = median raphe

