Figure 6.

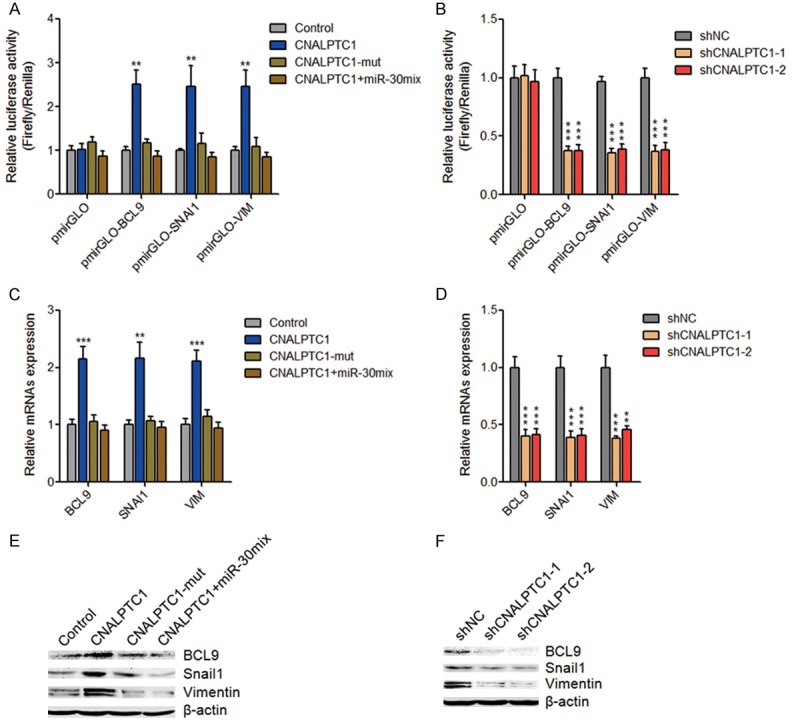
CNALPTC1 up-regulates miR-30 targets BCL9, SNAI1, and VIM expression. A. Luciferase activities of pmirGLO, pmirGLO-BCL9, pmirGLO-SNAI1, or pmirGLO-VIM upon transfection of CNALPTC1 or miR-30 binding site mutated CNALPTC1 (CNALPTC1-mut) overexpression plasmids, or co-transfection of CNALPTC1 overexpression plasmids and miR-30 mimics mix. Results are presented as the relative ratio of firefly luciferase activity to renilla luciferase activity. B. Luciferase activities of pmirGLO, pmirGLO-BCL9, pmirGLO-SNAI1, or pmirGLO-VIM in CNALPTC1 stably depleted and control TPC-1 cells. Results are presented as the relative ratio of firefly luciferase activity to renilla luciferase activity. C. After transfection of CNALPTC1 or CNALPTC1-mut overexpression plasmids, or co-transfection of CNALPTC1 overexpression plasmids and miR-30 mimics mix into TPC-1 cells, BCL9, SNAI1, and VIM RNA expression levels were determined by qRT-PCR. D. BCL9, SNAI1, and VIM RNA expression levels were determined by qRT-PCR in CNALPTC1 stably depleted and control TPC-1 cells. E. After transfection of CNALPTC1 or CNALPTC1-mut overexpression plasmids, or co-transfection of CNALPTC1 overexpression plasmids and miR-30 mimics mix into TPC-1 cells, BCL9, SNAI1, and VIM protein expression levels were determined by western blot. F. BCL9, SNAI1, and VIM protein expression levels were determined by western blot in CNALPTC1 stably depleted and control TPC-1 cells. Results are shown as mean ± s.d. of 3 independent experiments. **P < 0.01, ***P < 0.001 by Student’s t-test. qRT-PCR, quantitative real-time PCR.
