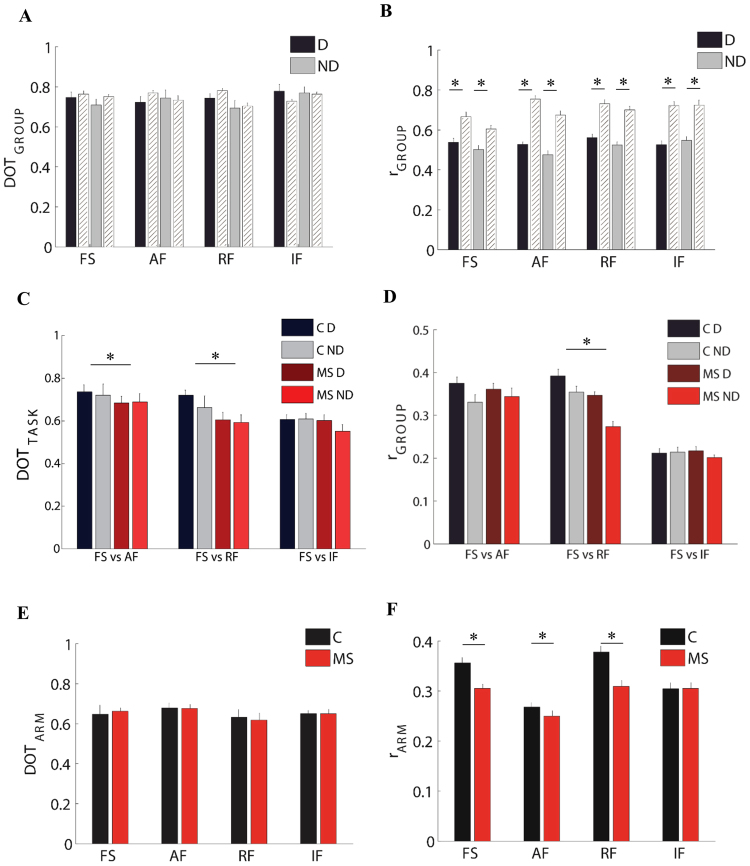
Figure 5.
Comparison of weight and activation coefficients of the muscle synergies between groups, tasks, and arms. Left columns: comparison of weight coefficients by the scalar product (DOT). Left columns: comparison of activation coefficients by the Pearson correlation (r). First row: MS subjects compared to control subjects i.e. inter-groups indicator for the dominant (D, black bars) and the non-dominant (ND, gray bars) arm compared to the same indicator computed intra-group (white bars). Second row: comparison of the FS task with the AF, RF and IF tasks respectively, both for the dominant (D) and non-dominant (ND) arm. Third row: comparison between the two arms for MS subjects (MS, red bars) and control subjects (C, black bars). The error bars represent the standard errors. * indicates significant differences (p < 0.05) between subject groups.

