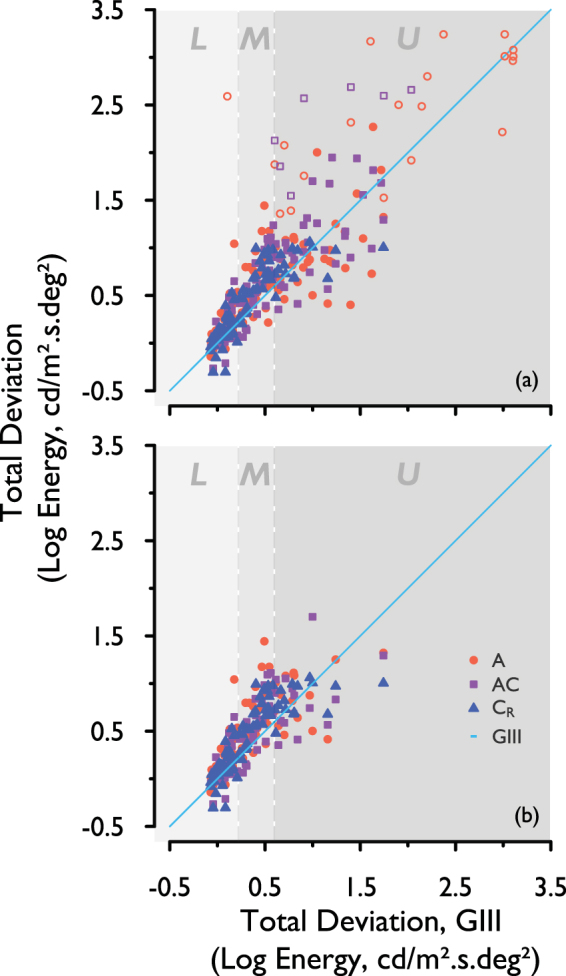
Figure 4.

TD for each stimulus form, plotted against TD for the GIII, for (a) complete and (b) matched data, pooled across the four visual field locations. Light-blue line: TD with the GIII (reference) stimulus. L, M, U: Lower, middle, and upper strata representing three levels of disease severity studied here. Unfilled data points: interpolated SAP sensitivity converted to TD, where TD could not be measured for the GIII with the experimental apparatus.
