
Figure 6.
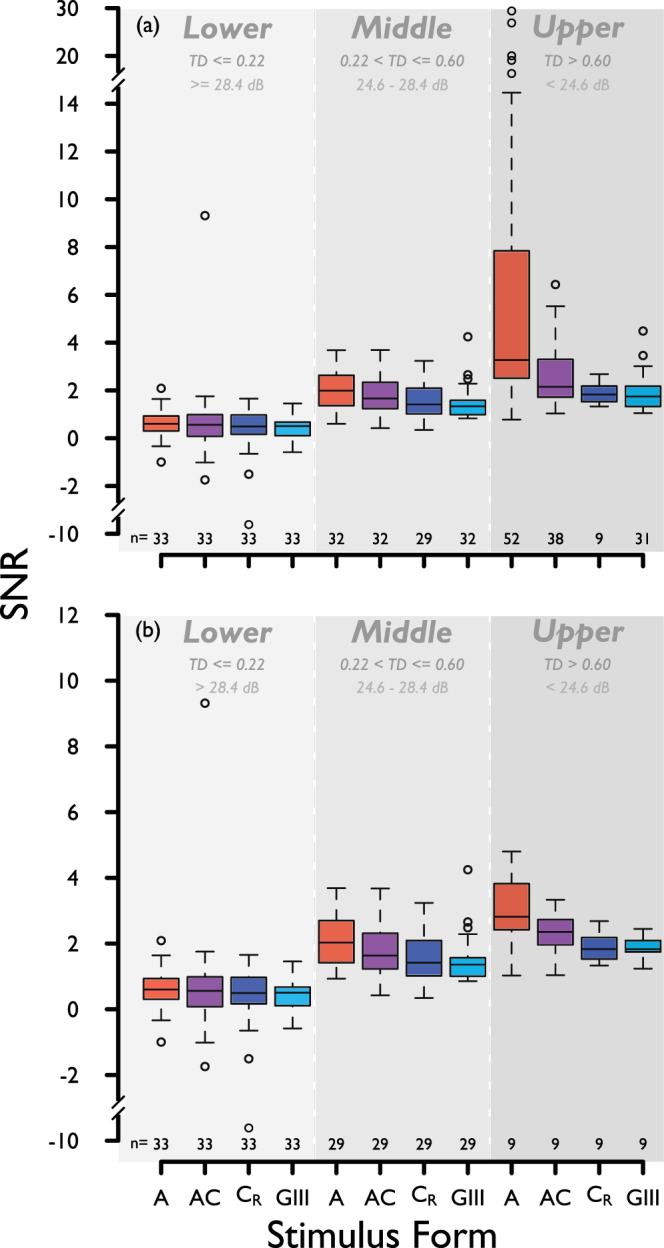
SNR for each stimulus form, for three strata of disease severity, lower, middle and upper percentiles (according to TD with the GIII stimulus, same strata as in Fig. 4. Boundaries between strata indicated in both log energy, and HFA II-equivalent sensitivity), for (a) complete and (b) matched data, pooled across all four visual field locations. Sample size (n) is given below each box. The y-axis in (b) is scaled up for ease of data visualisation.