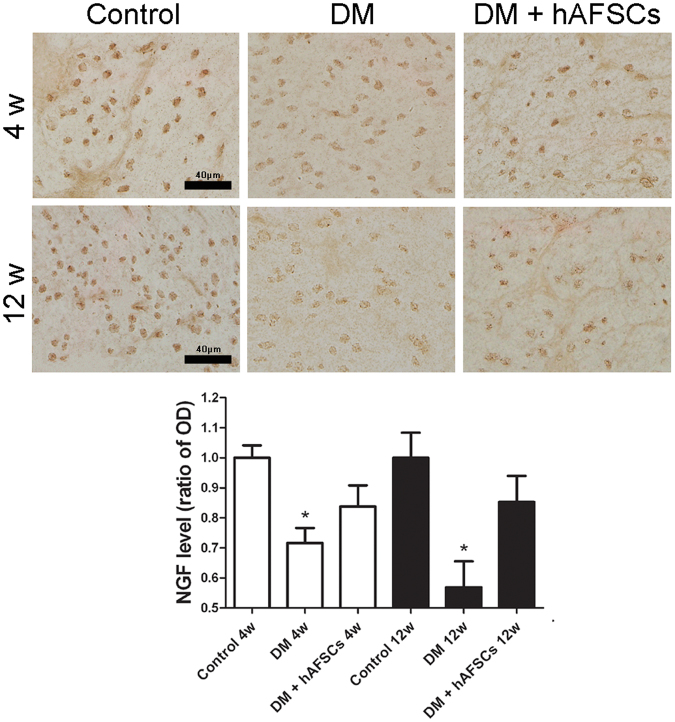
Figure 4.
Temporal expressions of nerve growth factor (NGF) immunoreactivity in the bladder of control, STZ-induced diabetic rats (DM) and diabetic rats + hAFSCs transplantation (DM + hAFSCs). The immunoreactivity of NGF can be seen in control rats (A), diabetic rats (B), and diabetic rats + hAFSCs transplantation (C) at 4 weeks, and in control rats (D), diabetic rats (E), and diabetic rats + hAFSCs transplantation (F) at 12 weeks. When compared to the controls, the expressions of NGF in the diabetic rats are significantly decreased, but can be recovered to near the control level after hAFSCs transplantation. OD = optical density. Bar indicates 40 μm. *P < 0.05 vs. control group. N = 10 in each time point.

