Figure 2.
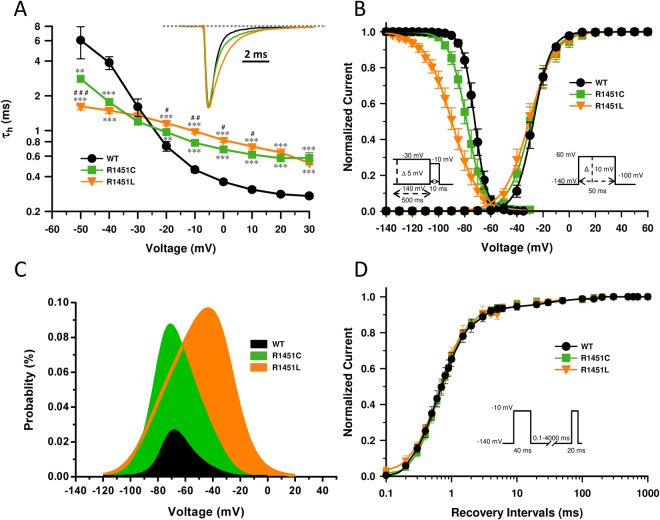
Gating properties of the channels. (A) The voltage dependence of the inactivation time constants of the WT (n = 9), R1451C (n = 8), and R1451L (n = 15) channels. The time course of the current decay elicited at depolarized voltages was best fitted to a single exponential function, and the resulting time constants (τh) were plotted against voltage. The kinetics of fast inactivation were slower for the R1451C and R1451L channels, with R1451L being the slowest. The inset shows representative normalized Na+ currents elicited at −10 mV. The statistical significances of the differences between WT and R1451C/L (**P < 0.001, ***P < 0.001) and between R1451C and R1451L (#P < 0.05, ##P < 0.001, ###P < 0.001) are shown. (B) Steady-state activation and inactivation of the WT and the mutants. No significant shifts in the V1/2 of the R1451C/L channels were observed. Steady-state inactivation was determined using 10 ms test pulses to −10 mV after a 500-ms pre-pulse to potentials ranging from −140 mV to −30 mV (see protocol in the inset under the inactivation curves). The inactivation curves of R1451C and R1451L channels were left-shifted by −6 mV and −20 mV, respectively. The V1/2, the kv and the n values are given in Table 1. (C) Effect of R1451C/L on NaV1.4 window current. The probability of being within this window was calculated through the following equation: (1/{1 + exp[(V1/2act − V)/kact]} × ((1 − C)/{1 + exp[(V − V1/2inact)/kinact]} + C). R1451C/L mutations produced a 5 and 7-fold increase in the window current, respectively (D) Recovery from inactivation of WT (n = 5), R1451C (n = 8) and R1451L (n = 6) channels. The cells were depolarized to −10 mV for 40 ms from a holding potential of −140 mV to inactivate the Na+ channels. Test pulses were then applied to −10 mV for 20 ms to measure current amplitudes, with an interval ranging from 0.1 to 4000 ms. The resulting curves were fitted to a single exponential equation. No significant effect was observed. The values are given in Table 1.

