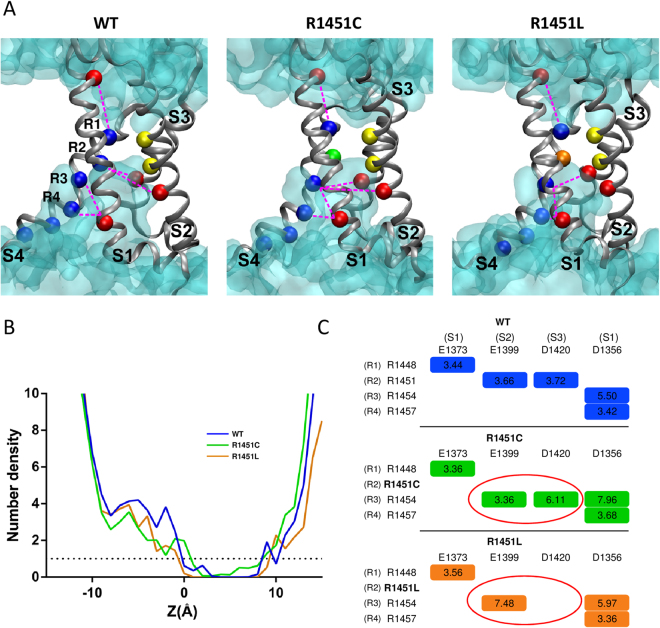
Figure 5.
Structural model of the resting state VSD of DIV of the WT, R1451C, and R1451L channels. (A) The backbones of the S1, S2, S3, and S4 transmembrane segments are represented as gray ribbons. The positively charged Arginine (R) residues of S4 are represented as blue balls, and the negative counter charges are in red. The conserved residues of S2 that define the hydrophobic seal are in yellow. The R1451C and R1451L substitutions are in green and orange, respectively. The hourglass-like solvent accessible volume is shown as a transparent turquoise surface. The hydrogen bonds between the charged residues are shown as pink dotted lines. For clarity, the dotted lines are between αC of the residues instead of the side chains. (B) Chart representing the water profile in the VSD. The number of water molecules is shown as a function of distance, where 0 Å is the center of the membrane. The dotted line indicates the limit of the hydrophobic septum. Less than one water molecule is found below this line. (C) Table indicating the hydrogen bonds shown in (A) and their distances in Å. Red circles highlight differences between mutant and WT channels.

