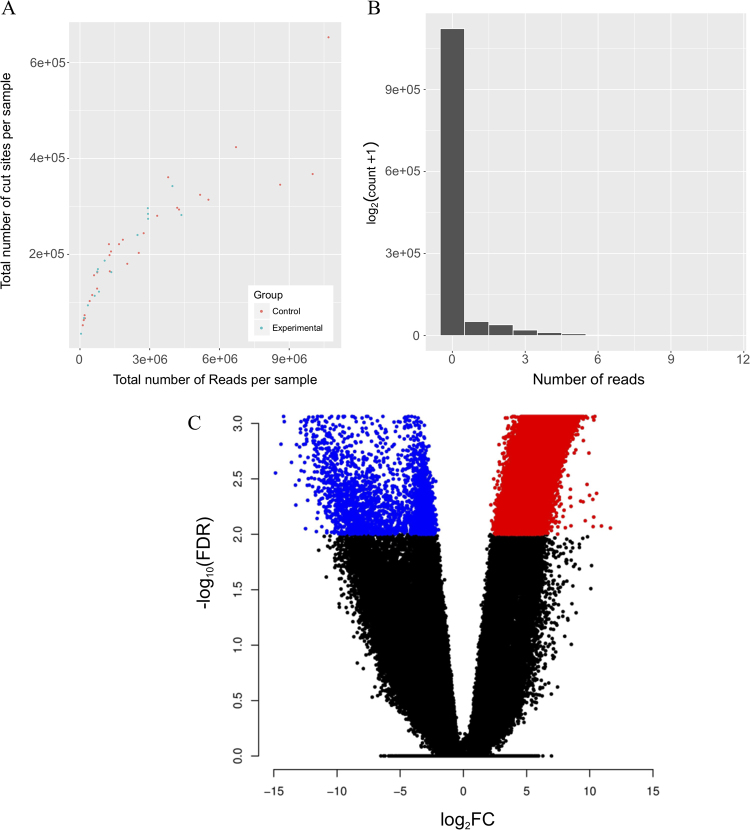
Figure 3.
The msgbsR pipeline on our rat prostate MRE-seq data. (A) Output of the plotCounts function showing the distribution of the total number of reads and cut sites per sample. Samples are coloured depending on their diet group. (B) A histogram of reads for a control sample showing a negative distribution. (C) A volcano plot showing differentially methylated sites (FDR < 0.01) between the control diet (blue dots) and the experimental diet (red dots).

