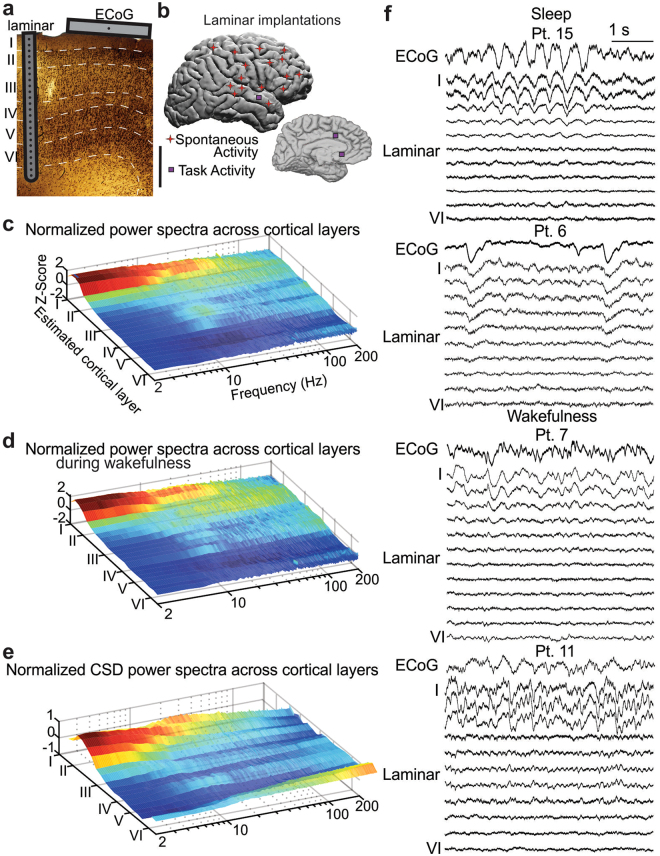
Figure 1.
Slow rhythms are generated in superficial cortical layers. (a) A schematic of an implanted laminar array and surface ECoG contact in a single patient, overlying a histological section taken from an implantation site. The laminar array comprises 24 contacts on 150 µ centers. Each bipolar Local Field Potential gradient (LFPg) recording measures activity from one layer of a single cortical domain. In contrast, the ECoG grid measures activity averaged across all layers from multiple cortical domains (Scale bar: 1 mm). The microelectrode reference scheme is illustrated in Supplementary Fig. 1. (b) Approximate location of laminar implantation in 19 patients. Implants could be in either hemisphere. (c) Overall distribution of spectral power across cortical layers. Spontaneous LFPg power was z-normalized across layers to correct for 1/f scaling, and averaged across 16 subjects for sleep and wakefulness, using 1-Hz Gaussian frequency smoothing. Individual subject data is shown in Supplementary Fig. 2. (d) Normalized power spectral density during wake recordings only. Note that delta/theta band activity is still focally generated in superficial cortical layers. (e) Normalized power spectral density using current source density (CSD) instead of the local field potential gradient (LFPg). Delta/theta oscillations are still localized to superficial layers. (f) Raw data from simultaneous ECoG and laminar recordings during sleep and wakefulness. Note that delta/theta activity is strongest in superficial layers during both states.

