Figure 1.
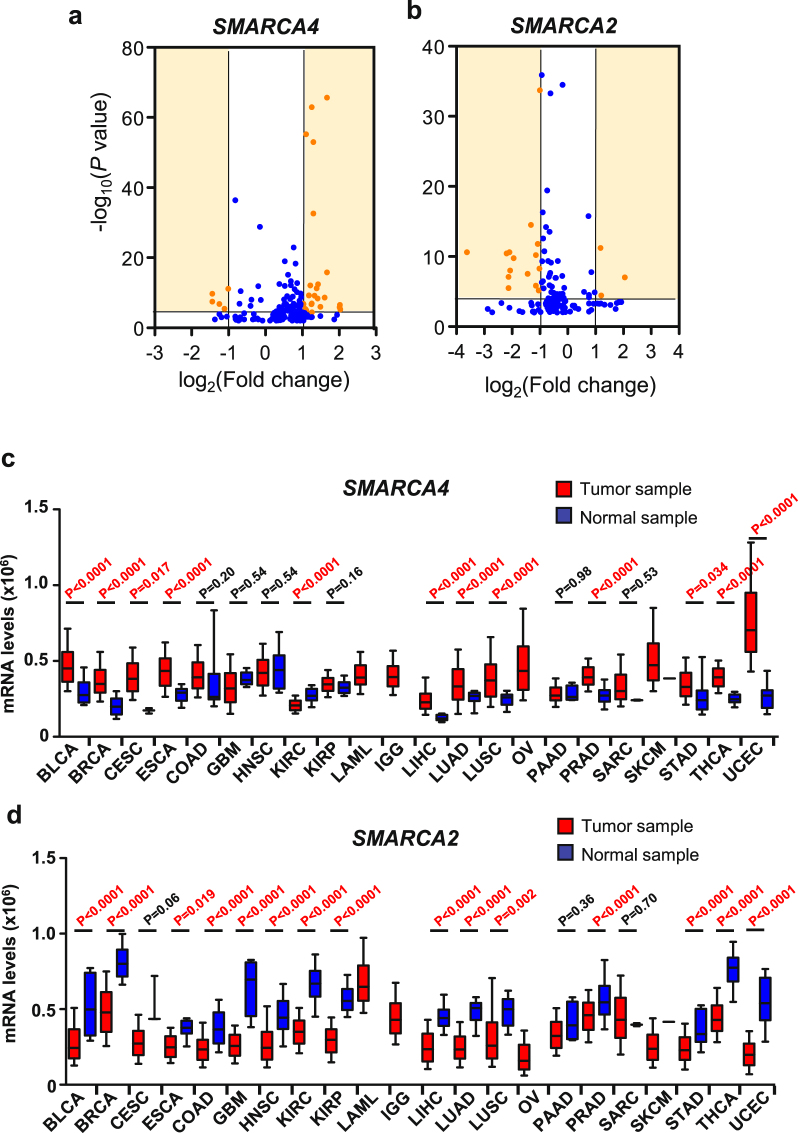
SMARCA4 is overexpressed, and SMARCA2 is underexpressed, in multiple types of tumors. (a,b) Volcano plots of SMARCA4 (a) or SMARCA2 (b) expression change (log2(FC)) in tumors with respect to normal samples versus significance (−log10(P value)), from different datasets. Data were obtained from ONCOMINE. Datasets with changes of P > 0.01 were not included. Highly significant changes (P ≤ 0.0001 and |FC| ≥ 2) are highlighted in orange and listed in Supplementary Tables S1 and S2. (c,d) Boxplot of levels of SMARCA4 (c) or SMARCA2 (d) mRNA (RNA-seq data) in normal or tumor samples of 22 different tumor cohorts from TCGA. Names and number of tumors and normal samples are listed in Supplementary Table S3. Significant Student’s t-test P value (P ≤ 0.05) are depicted in red.

