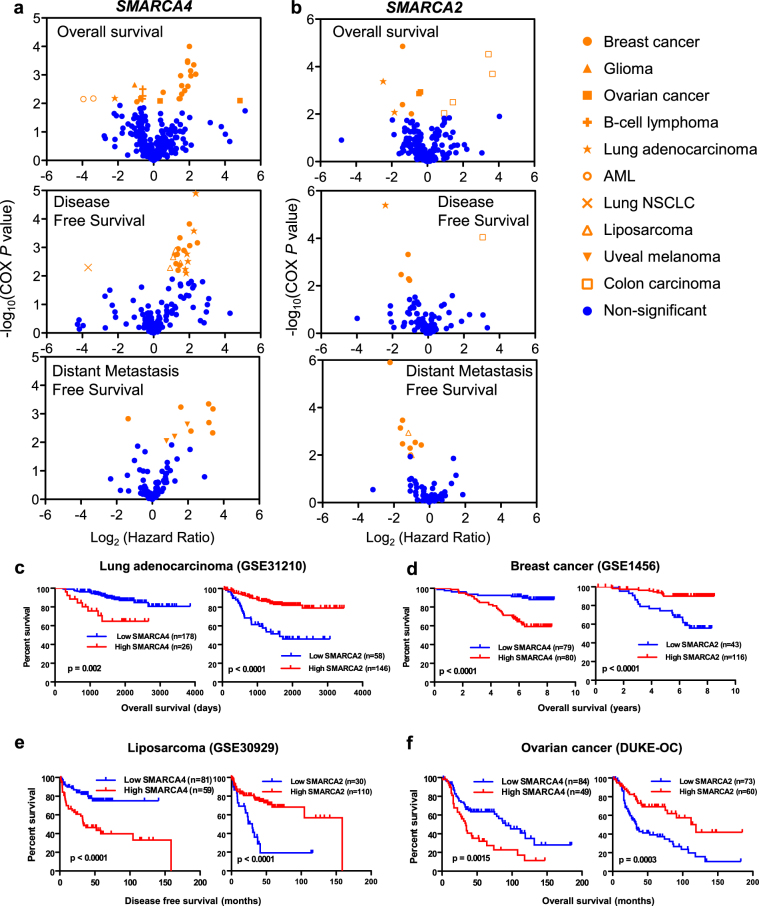
Figure 2.
Meta-analysis of prognosis consequences of SMARCA4 or SMARCA2 upregulation. (a,b) Cox regression analysis of the correlation between SMARCA4 (a) or SMARCA2 (b) tumor expression levels and patient survival in different studies (data collected from PrognoScan). Volcano plots of log2(HR) versus significance (−log10(COX P value)) from different datasets are shown. A positive log2(HR) value indicates that the analyzed risk increases when the level of gene expression increases, and thus the prognosis is worse. Conversely, a negative Log2(HR) value implies a better prognosis for patients with tumors with higher values of gene expression. Different survival endpoints (overall survival, disease-free survival, and distant metastasis–free survival) are shown in different graphics. Significant changes (COX P ≤ 0.01) are highlighted in orange. (c–f) Kaplan-Meier plots showing inverse prognosis behavior of SMARCA4 and SMARCA2 expression in the same studies. Data corresponding to four different types of tumors are shown: lung adenocarcinoma104, breast cancer105, liposarcoma106, and ovarian cancer107. GEO references of the data are provided when available. Long-rank test P values are provided. Patient tumors were divided into two expression groups (high and low) according to PrognoScan (see Methods).

