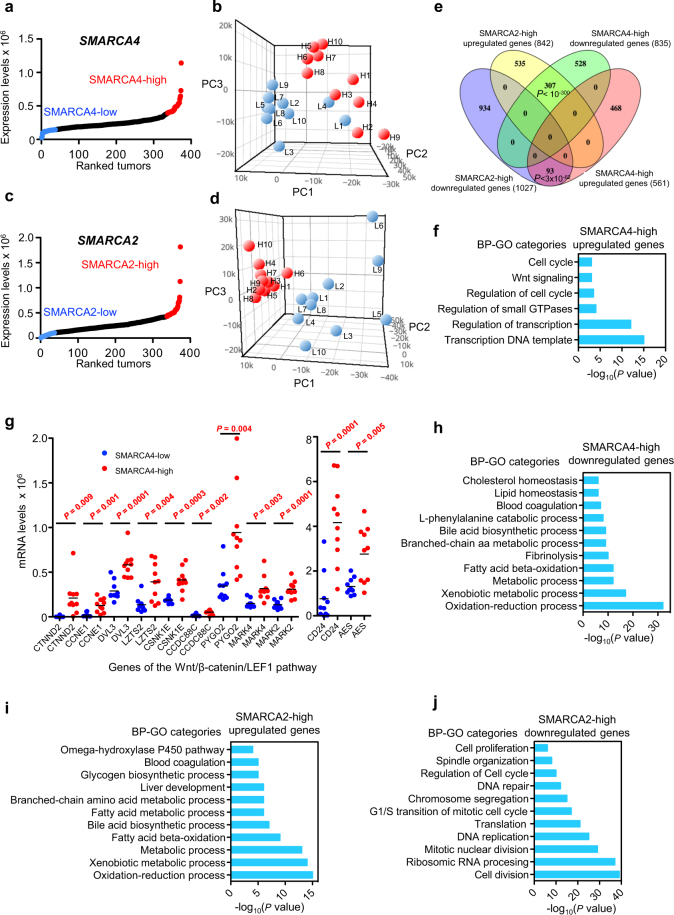
Figure 5.
Transcriptome changes associated with SMARCA4 or SMARCA2 upregulation in LIHC. (a,c) Ranking (x-axis) of LIHC tumor samples according to SMARCA4 (a) or SMARCA2 (c) expression (normalized RNA-seq data) (y-axis). Dots corresponding to upper and lower deciles are depicted in red and blue, respectively. (b) Principal component (PC) analysis of transcriptomic data from ten SMARCA4-high (red) or ten SMARCA4-low (blue) tumors. (d) PC analysis of transcriptomic data from ten SMARCA2-high (red) or ten SMARCA2-low (blue) tumors. (e) Venn diagram showing overlap between SMARCA2-high upregulated and SMARCA4-high downregulated genes, and between SMARCA2-high downregulated and SMARCA4-high upregulated genes. Significance of overlap based on the hypergeometric test is provided. (f) Biological process (BP)-GO categories enriched in SMARCA4-high upregulated genes. (g) Expression levels (normalized RNA-seq data) of genes in the Wnt/β-catenin/LEF1 signal transduction pathway in SMARCA4-high and SMARCA4-low LIHC tumors. Student’s t-test P values are shown. (h) BP-GO categories enriched in SMARCA4-high downregulated genes. (i,j) BP-GO categories enriched in SMARCA2-high upregulated (i) and SMARCA2-high downregulated (j) genes. (f,h–j) Significance of the enrichment are presented as the P values of the hypergeometric test (−log10 transformed).

