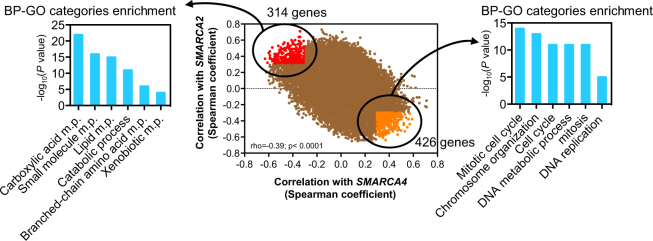
Figure 6.
Analysis of genes co-expressed with SMARCA4 and SMARCA2 in LIHC. Scatter plot with each dot corresponding to a gene, with the x and y coordinates as the Spearman coexpression correlation coefficient of the gene with SMARCA4 and SMARCA2, respectively (central panel). Spearman correlation coefficient (rho) and P values are shown. Genes that were more positively correlated with SMARCA4 (rho ≥ 0.3) and negatively correlated with SMARCA2 (rho ≤ −0.3) are depicted in orange. Genes that were more negatively correlated with SMARCA4 (rho ≤ −0.3) and positively correlated with SMARCA2 (rho ≥ 0.3) are depicted in red. Enrichment of GO categories is given for genes negatively correlated with SMARCA4 and positively correlated with SMARCA2 (left panels) and for genes positively correlated with SMARCA4 and negatively correlated with SMARCA2 (right panels). m.p. metabolic process.

