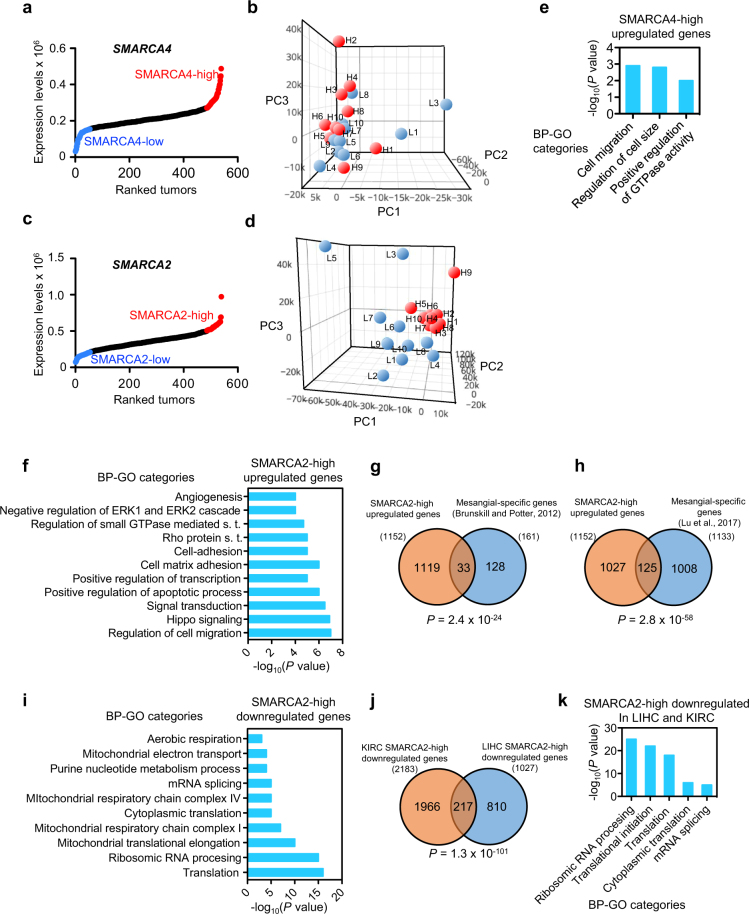
Figure 7.
Transcriptome changes associated with SMARCA4 or SMARCA2 upregulation in KIRC. Ranking (x-axis) of KIRC tumor samples according to SMARCA4 (a) or SMARCA2 (c) expression (normalized RNA-seq data) (y-axis). Dots corresponding to the upper or lower decile are depicted in red or blue, respectively. (b) PC analysis of transcriptomic data from ten SMARCA4-high (red) and ten SMARCA4-low (blue) tumors. (d) PC analysis of transcriptomic data from ten SMARCA2-high (red) and ten SMARCA2-low (blue) tumors. (e,f) BP-GO categories enriched in SMARCA4-high (e) or SMARCA2-high (f) upregulated genes. s.t. signal transduction. (g,h) Overlapping between SMARCA2-high upregulated genes and mesangial cells-specific genes from two independent studies66: (g) and67 (GSE92650) (h). (i) BP-GO categories enriched in SMARCA2-high downregulated genes. (j) Overlap between SMARCA2-high downregulated genes from LIHC and KIRC tumors. (g,h,j) P values of the hypergeometric test. (k) BP-GO categories enriched in genes overlapping between SMARCA2-high upregulated genes from LIHC and from KIRC tumors. (e,f,i,k) Significance of the enrichments are given as the P values of the hypergeometric test (−log10 transformed).

