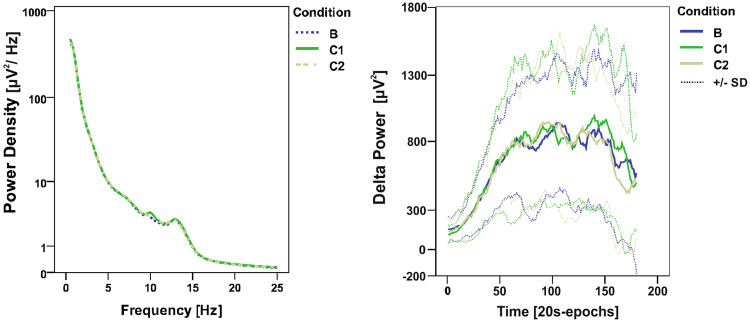
Figure 3.
Average power density spectra and build-up of delta power. Left: power density spectra averaged over NREM sleep of the entire night in all three experimental conditions. Right: build-up of delta power and standard deviation (SD) during the first hour after sleep onset (20-s epochs, moving average over 7 epochs). (Experimental conditions: Baseline (B), vestibular stimulation until sleep onset (C1), vestibular stimulation for 2 hours after lights out).

