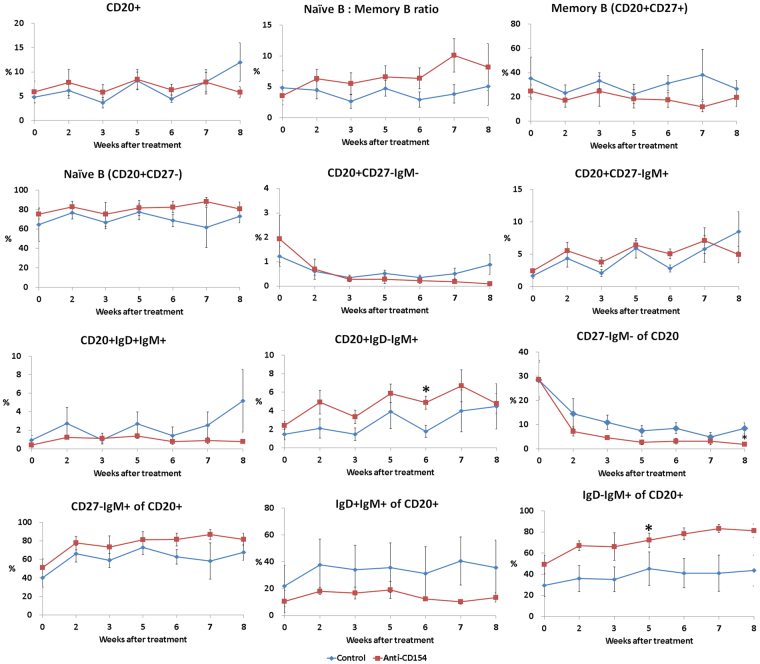
Figure 4.
Comparison of B-cell subsets. Flow cytometric analysis for B-cell subsets was performed using blood samples collected before treatment and at 2, 3, 5, 6, 7, and 8 weeks after treatment. PBMCs were stained with antibodies against CD45, CD3, CD20, CD27, CD21, IgD, and IgM. Data are expressed as the mean ± SEM (n = 4 per group). The means of groups at each time points were compared using student t-tests. *Significant (p < 0.05) differences from the control group are indicated.

