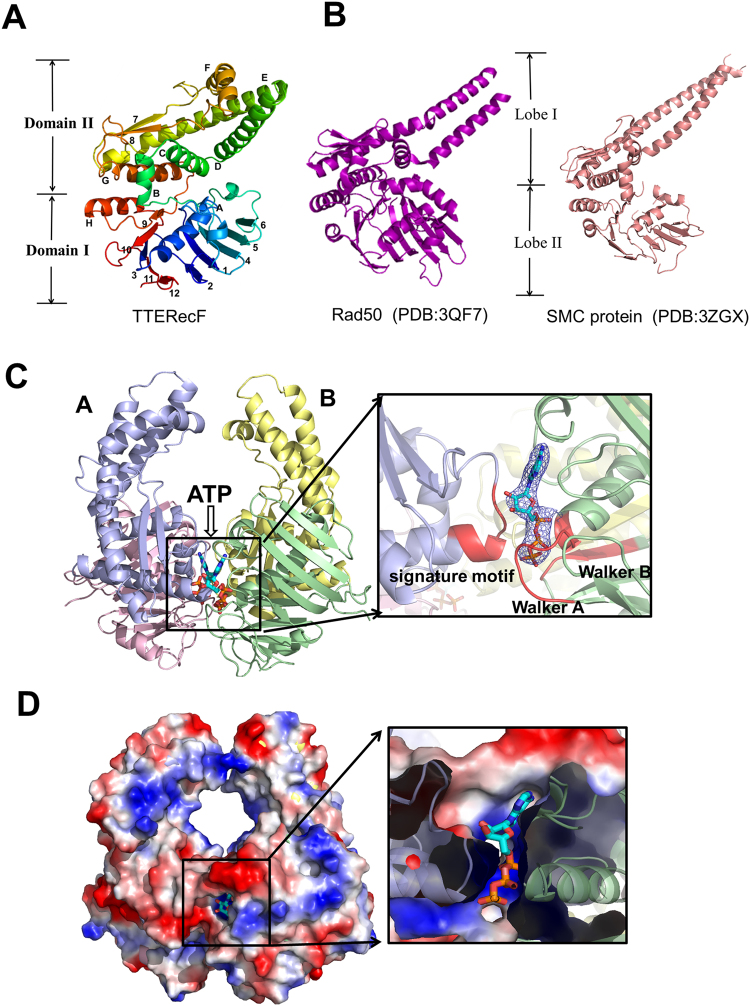
Figure 1.
Crystal structures of TTERecF and TTERecF-ATP. (A) Cartoon representation of TTERecF. β-strands are numbered and α-helixes are lettered. The labels for domains I and II are indicated on the left. (B) Cartoon representations of the Rad50 (PDB:3QF7) and SMC protein (PDB:3ZGX) are shown in purple and salmon, respectively; the labels for lobes I and II are indicated in the middle. (C) The substrate ATP binds to TTERecF; TTERecF is shown as cartoon and the substrate is represented by sticks. Domains I and II are shown in pink and light blue, respectively, in the TTERecF A molecule, but green and yellow, respectively, in the TTERecF B molecule. The Walker A motif, Walker B motif, and the signature motif in the active site are shown in red. The 2FO- FC electron density for ATP contoured at the 1.0σ level is shown as blue mesh. (D) Electrostatic properties of TTERecF and sliced surface view of the ATP binding tunnel. The complexes are shown as solvent-accessible surfaces coloured by electrostatic potential (red, acidic; blue, basic).

