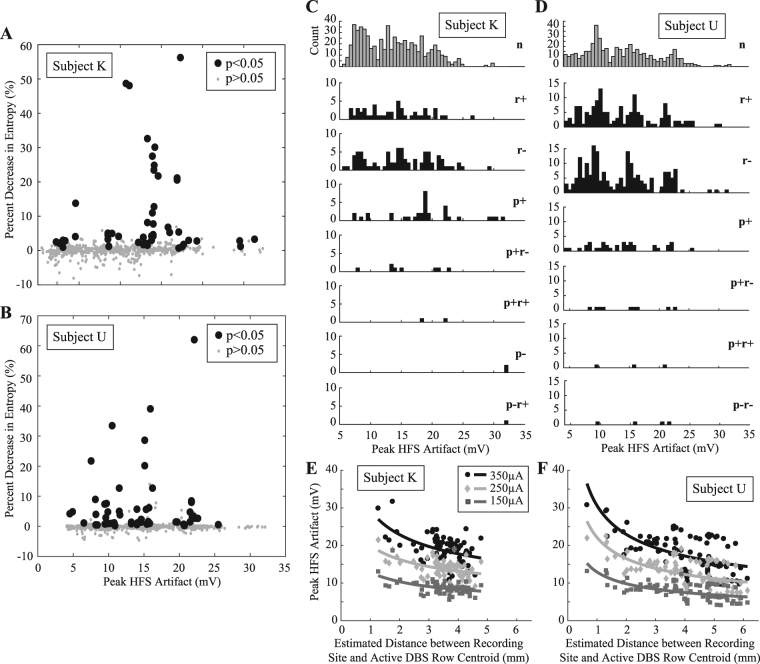
Figure 6.
Distribution of modulated motor thalamic activity with respect to stimulation artifact size. Percent decrease in PSTH entropy between the HFS-off and HFS-on periods plotted against the peak amplitude of the recorded HFS artifact for (A) Subject K and (B) Subject U. Recordings that exhibited significant firing pattern modulation during HFS are labeled as large black solid circles. (C,D) Spatial distribution of neuronal recordings grouped by their response to HFS (p: firing pattern modulation, r: firing rate modulation. ‘+’: increase in firing rate or phase-locked spike activity, ‘−’: decrease in firing rate or phase-locked spike activity, n: no response). (E,F) Relationship between the stimulus artifact peak amplitude and the estimated recording site distance from the centroid point of the active DBS row. Shown are data for both subjects categorized based on stimulus amplitude (150, 250, and 350 µA).

