Figure 1.
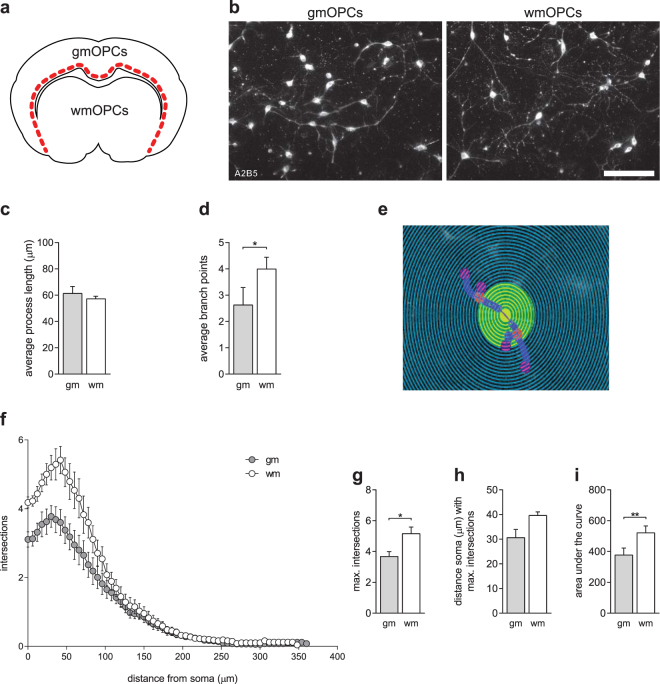
GmOPCs are morphologically less mature than wmOPCs. Oligodendrocyte progenitor cells (OPCs) isolated from the cortex (gmOPCs) and non-cortex (wmOPCs) of neonatal rat forebrains were cultured in the presence of PDGF-AA and FGF-2 for 48 hours. (a) Schematic representation of dissected areas of neonatal rat forebrains to obtain gmOPCs and wmOPCs (b) OPCs stained with the OPC cell surface marker antibody A2B5. Representative images are shown. (c–h) Analysis of the morphology of (b) using Sholl analysis of gmOPCs and wmOPCs of the same batch. The process length (c), the number of branch points (d), the number of processes that intersect with the concentric circles of the Sholl analysis as a function of the distance from the soma (f), maximum intersections (g), distance of the soma with the maximum number of branch points (h) and area under the curve (i) are shown. A representative image of the Sholl analysis is shown in (e). Note that while the process length is similar, wmOPCs have more branch points, a larger maximum of intersections and total area under the Sholl curve, indicating a more complex branched phenotype than gmOPCs. Bars represent mean process length (c), branch points (d), maximum intersections (g), distance of the soma with the maximum number of branch points (h) and area under the curve (i) of five independent experiments (24–26 cells analysed per independent experiment). Error bars show the standard error of the mean. Statistical analyses were performed using a paired two-sided t-test (*p < 0.05, **p < 0.01). Scale bar is 50 µm.

