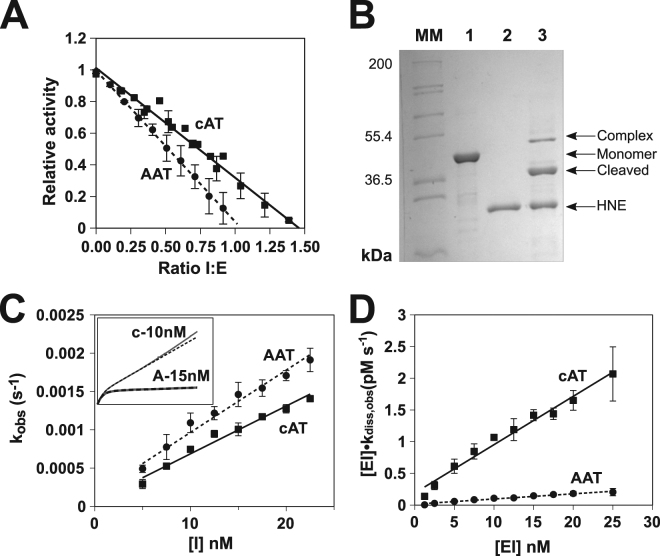
Figure 2.
Serpin-enzyme complex formation by cAT. (A) Residual protease activity following the incubation at 25 °C of cAT with chymotrypsin at various molar ratios; the intercept of the linear regression with the abscissa is equivalent to the stoichiometry of inhibition for cAT (solid line) in comparison with α1-AT (dashed line). Error bars represent ± SEM for four independent experiments. (B) SDS-PAGE (10% w/v) of cAT incubated with human neutrophil elastase (HNE) at 37 °C for 2 hours. MM, molecular marker; lane 1, cAT control; lane 2, HNE; lane 4, cAT and HNE incubated at equimolar concentration. Monomer, cleaved and serpin-enzyme complex bands are labelled. (C) The inhibition of chymotrypsin by several concentrations of cAT and α1-AT was followed over time at 25 °C, from which the apparent second-order rate constant (kobs) was calculated. The slope of the relationship between inhibitor concentration and kobs provides the uncorrected second-order rate constant, kapp. Error bars represent ± SEM (n = 4). The inset graph shows representative progress curves of cAT (c) and α1-AT (A) with approximately equal kobs values. (D) The dissociation of the complex between chymotrypsin and cAT or α1-AT was followed as the rate of regain of protease activity at 25 °C following dilution from 5 µM to the concentrations shown. The slope of the resulting regression provides the apparent rate constant, kdiss,app. Error bars represent ± SEM (n = 4).

