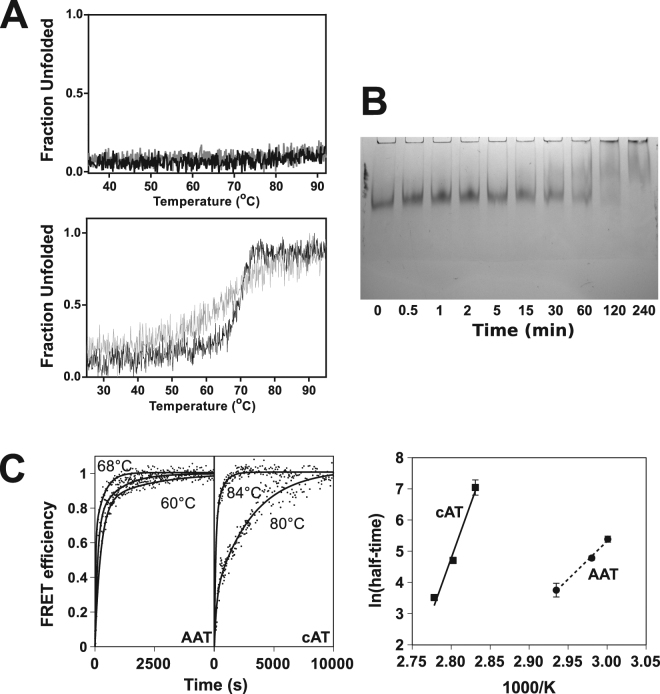
Figure 3.
Heat-induced oligomerisation of cAT. (A) Upper panel: Thermal unfolding of 0.2 mg mL−1 cAT, heated from 25 °C to 95 °C at a rate of 1 °C min−1, monitored by the change in CD signal at 222 nm (black). The sample was then returned to the starting temperature at the same rate (grey). Lower panel: A representative thermal melt performed in the presence of 2 M of GdnHCl. (B) cAT (at 10 µM) was heated at 75 °C, 3 µL aliquots removed at various timepoints, and the oligomerisation state resolved by 6% non-denaturing PAGE. No monomer was visible at the conclusion of the experiment. (C) Left panel: cAT or α1-AT labelled with Atto 488 and Atto 594 fluorescent dyes at a concentration of 0.1 mg ml−1 in PBS was heated at temperatures between 80–87 °C and 60–68 °C, respectively, and the increase in FRET between the fluorophores determined over time. Points reflect representative data normalised between 0 and 1, with the curves of best fit as solid lines. Right panel: The natural logarithm half-times of the change in FRET were plotted against the reciprocal inverse absolute temperature; the slopes of the regressions are proportional to the apparent activation energy of polymerisation under the conditions of the experiment. Error bars reflect ± SEM (n = 4).

