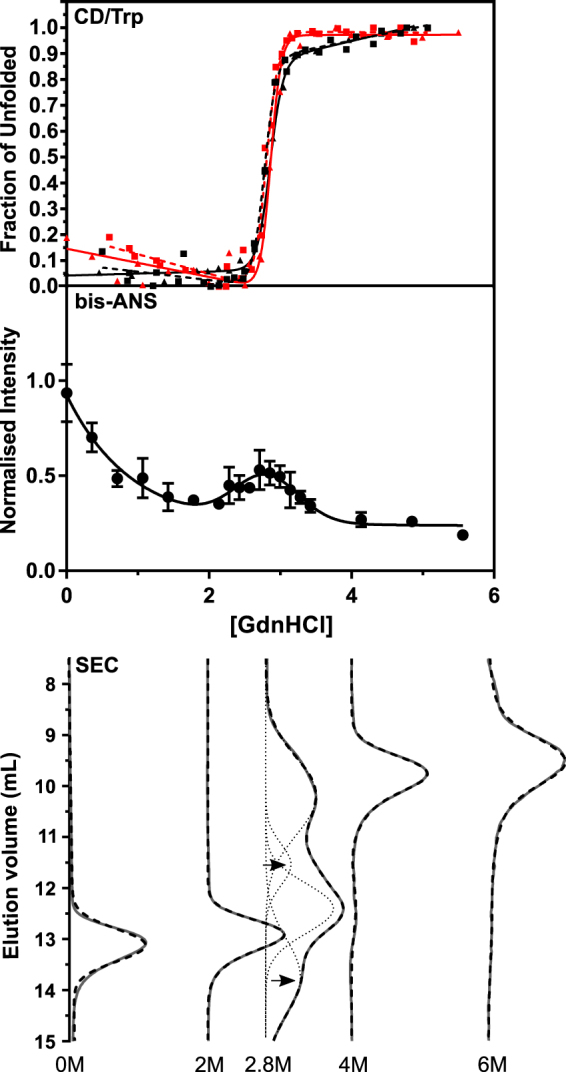
Figure 4.

cAT populates an intermediate state over a narrow range of denaturant. Upper panel: Equilibrium GdnHCl-mediated unfolding (solid lines) and refolding (dotted lines) for cAT followed via the change in CD signal at 222 nm (black lines) and intrinsic fluorescence at 330 nm (red lines). Each dataset is the result of at least three independent experiments. A two-state unfolding curve was satisfactorily fit to the data; midpoints are listed in Table 1. Middle panel: cAT was incubated in varying concentrations of GdnHCl at 25 °C and bis-ANS added at 5 times the concentration of the protein. The fluorescence intensity was measured at 480 nm, with an excitation wavelength of 390 nm, and slit widths of 5 nm. Error bars reflect SD from three independent experiments, whose profiles were normalised according to their total integrated fluorescence intensity. The curve reflects the sum of an empirically-determined single exponential decay and Gaussian function. Lower panel: GdnHCl unfolding was monitored by size exclusion chromatography using a Superose 12 10/300 column, at the denaturant concentrations shown. The absorbance at 280 nm is shown in grey. The deconvoluted components of the 2.8 M sample are shown as dotted lines, the sums of the fitted components shown as dashed lines, and the experimental data as solid lines. Arrows indicate the expanded (top) and compact (bottom) intermediates.
