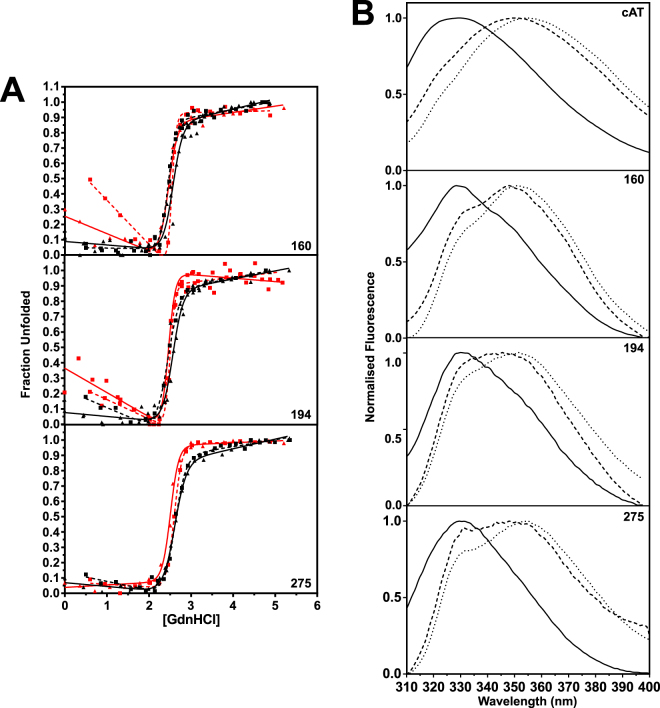
Figure 6.
Equilibrium unfolding of single-tryptophan variants of cAT. (A) Equilibrium GdnHCl-mediated unfolding (solid lines) and refolding (dotted lines) for cATW160, cATW194 and cATW275 followed by the change in CD signal at 222 nm (black lines) and intrinsic fluorescence at 330 nm (red lines). Each dataset is the result of at least three independent experiments. A two-state unfolding curve was fitted to the data. The concentration at which half the protein is unfolded (D50%) or refolded (D50% refold) is shown in Table 1. (B) Normalised fluorescence emission spectra of parental cAT, cATW160, cATW194 and cATW275 in buffer without denaturant (—), and in the presence of 2.6 M or 3 M of GdnHCl (---) and 6 M GdnHCl (···). All scans were conducted at 25 °C, with an excitation wavelength of 295 nm and slit widths of 5 nm.

