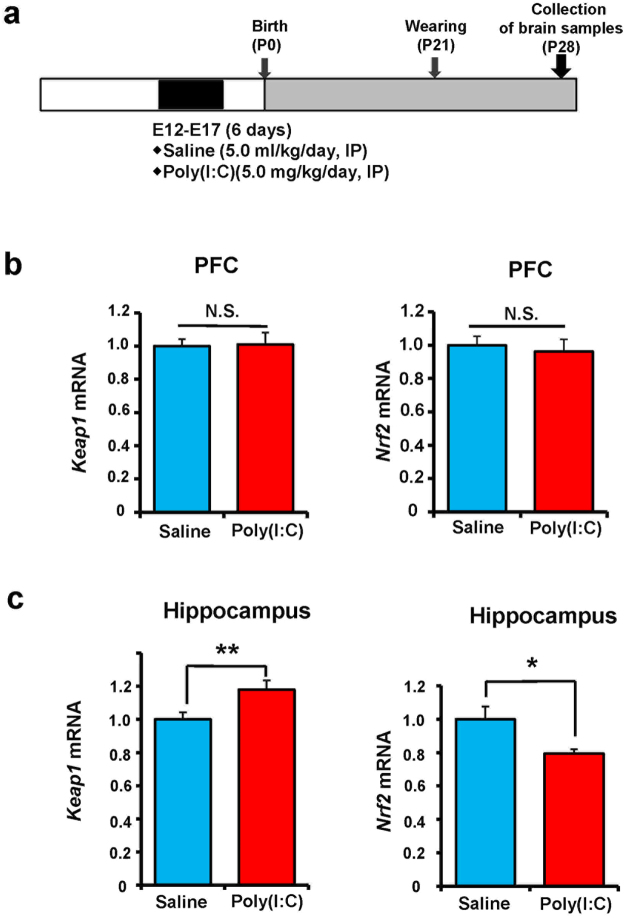
Figure 2.
Gene expression of Keap1 and Nrf2 in the PFC and hippocampus of juvenile offspring after prenatal poly(I:C) exposure. (a) Schedule of treatment and collection of brain samples. (b) There were no changes for gene expression of Keap1 (P = 0.903) and Nrf2 (P = 0.794) in the PFC. (c) There were significant changes for gene expression of Keap1 (P = 0.012) and Nrf2 (P = 0.023) in the hippocampus. Data represent the mean ± S.E.M. (n = 10 for saline-treated group, n = 14 for poly(I:C) group). *P < 0.05, **P < 0.01 compared with saline-treated group. NS: not significant.

