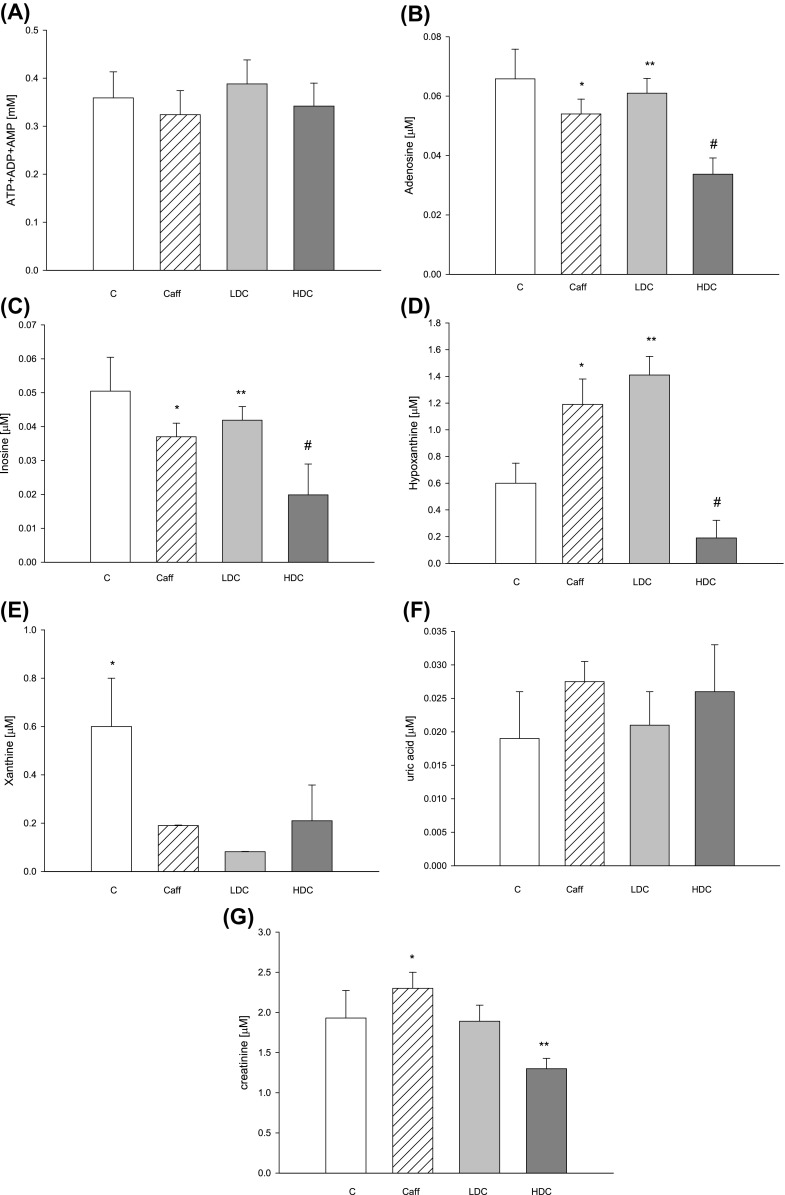
Fig. 4.

Concentrations of a adenine nucleotide, b adenosine, c inosine, d hypoxanthine, e xanthine f uric acid, g creatinine in serum; C control mice drunk water, Caff mice drunk caffeine coffee, LDC mice-treated low-dose decaffeinated coffee, HDC mice treated high-dose decaffeinated coffee. Values are mean ± SD, n = 6, b *p < 0.05 versus C, HDC; **p < 0.05 versus HDC, # p < 0.05 versus C; c *p < 0.05 versus C; **p < 0.05 versus HDC; # p < 0.05 versus C d *p < 0.05 versus C, HDC; **p < 0.05 versus C, HDC; # p < 0.05 versus Caff, LDC e *p < 0.05 versus all g *p < 0.05 versus LDC, HDC; **p < 0.05 versus C, Caff
