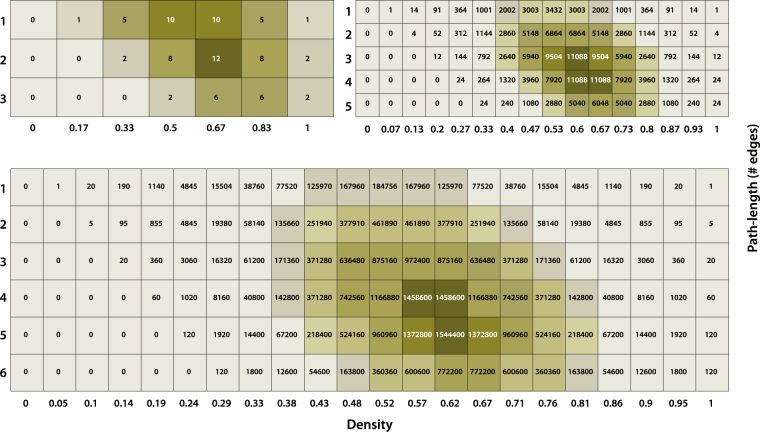
Figure 2.
Heatmaps displaying the landscapes of paths with respect to density and path-length. The matrices represent the number of paths possible for configurations of respectively 4 nodes (top left), 6 nodes (top right), and 7 nodes (bottom), when going from node 1 to node n, as function of density (x-axis) and path-length (y-axis). For 7 nodes, the highest numbers of paths possible are centred around a density of 0.62 with path-lengths around 4 to 5.

