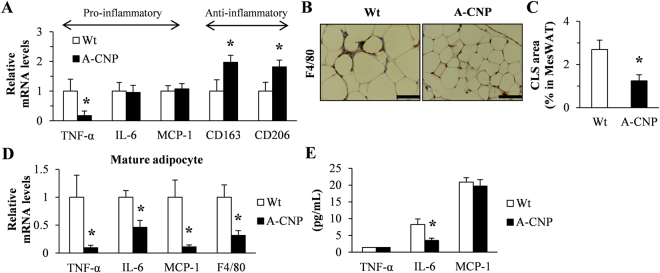
Figure 5.
A-CNP Tg mice showed protection against inflammation during HFD-induced obesity. (A) Expression of inflammatory cytokines in MesWAT was determined by qPCR analysis. (B and C) Immunohistochemical analysis and quantification of crown-like structures in A-CNP Tg mice by using anti-F4/80 staining. Scale bars, 50 μm. (D) Expression of inflammatory cytokines in mature adipocytes of MesWAT was determined by qPCR analysis. (E) Serum inflammatory cytokine levels were measured by ELISA. The data are presented as means ± SEM. n = 10 (A); n = 5 (B and C); n = 4 (D); n = 10 (E); *P < 0.05.

