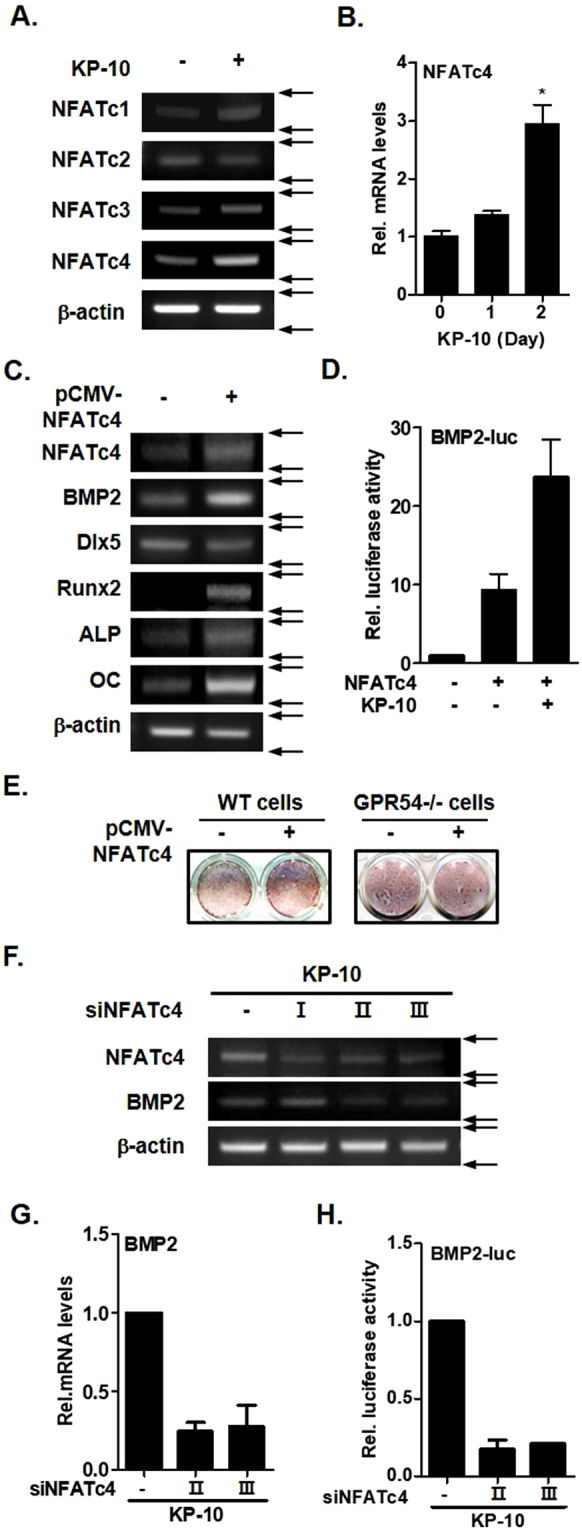
Figure 3.

NFATc4 mediates KP-10-induced BMP2 expression. (A) RT-PCR was performed using total RNA isolated from cells treated with 50 μM KP-10 for 2days. (B) Real-time PCR was performed using total RNA isolated from cells treated with 50 μM KP-10 for 1 and 2 days. *p < 0.05 compared with the untreated control. Data represent the mean ± SEM of three individual experiments. (C) RT-PCR was performed using total RNA isolated from cells transfected with pCMV-NFATc4 (0.4 μg). (D) Cells were transfected with BMP2-luc (0.4 μg) and pCMV-NFATc4 (0.4 μg) for 6 h and then treated with KP-10 (+; 50 μM). (E) WT or GPR54−/− C3H0T1/2 cells were cultured in the absence or pCMV-NFATc4 (0.4 μg). After 20 days, alizarin red S staining was performed to examine extracellular mineralization. (F) Cells were transfected with siNFATc4I, siNFATc4II or siNFATc4III for 6 h and then treated with KP-10 (+; 50 μM) for 2 days. Total RNA was isolated from the cell cultures, and RT-PCR analysis was performed with NFATc4, BMP2 and b-actin primers. (G) Real-time PCR was performed using total RNA isolated from cell transfected with siNFATc4II or siNFATc4III and then treated with 50 μM of KP-10 for 2 days. (H) Cells were co-transfected with BMP2-luc (0.4 μg) and siNFATc4 (2 or 3) for 6 h and then treated with KP-10 (+; 50 μM). I, II and III mean knockdown of NFATc4. These primers information is included in the materials and methods sessions.
