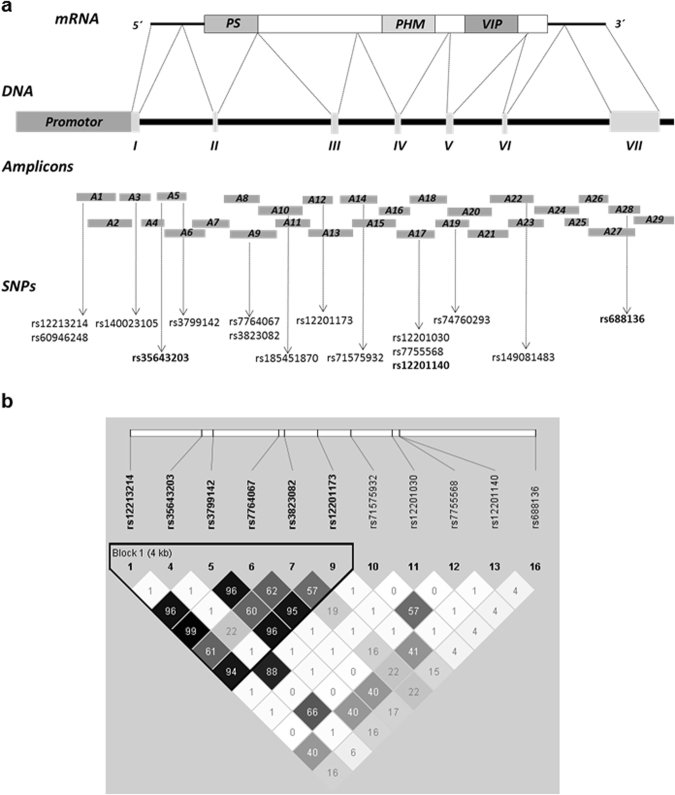
Figure 1.
Sequencing of VIP gene and linkage disequilibrium (LD) Plot. (a) Structural diagram of VIP gene comprising the promoter region, 7 exons and 6 introns. The upper diagram shows mRNA transcription and the bottom diagram represents the 29 overlapping amplicons used for sequencing, as well as the SNPs found. SNPs chosen for further study are highlighted in bold. (b) Plot showing LD patterns among genotyped SNPs. LD is measured as r2 and shown (×100) in the diamond at the intersection of diagonals from each SNP. r2 = 0 shown in white, 0 < r2 < 1 shown in grey and r2 = 1 shown in black. Top analysis track represents chromosomal location. Bold black line outlines one haplotype block designating markers in high LD.

