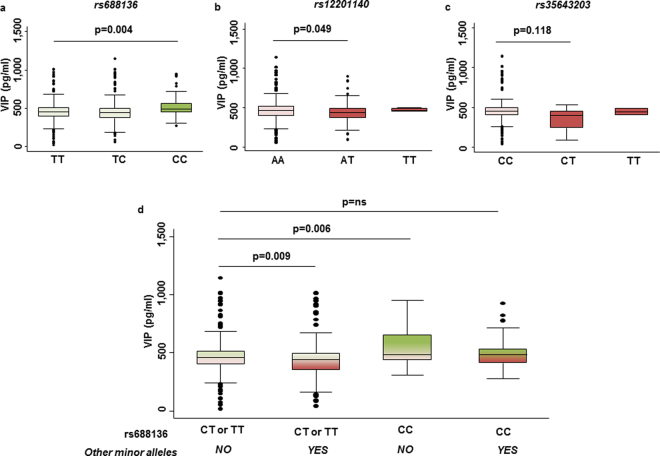
Figure 2.
Serum VIP levels in EA patients according to different genotypes. Serum VIP levels according to the genotype of the: (a) rs688136; (b) rs12201140; (c) rs35643203. (d) Interaction Score for different genotype combinations of VIP gene polymorphisms associated with VIP serum levels. In all panels data from the meta-analysis (n = 222) are presented as the interquartile range (p75 upper edge of the box, p25 bottom edge, and p50 midline), p90 and p10 (lines below and above the box) of the serum VIP levels. Statistical significance for a p-value < 0.05 was established by means of a multivariate analysis adjusted by age of onset and TNFα blockers and nested by patient and visit. Dots represent outliers. ns: non-significant.

