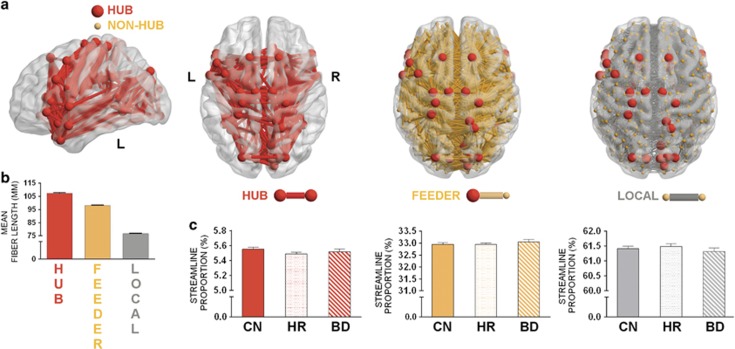
Figure 1.
Hub-regions and connection classes across the population groups. (a) Distribution of brain regions into hubs and non-hubs, with connections grouped into classes (hub, feeder or local). (b) Mean fibre length of each connection class across CNs. (c) Density of connections: left to right shows hub, feeder and local connections. Error bars indicate s.e.m. for each group. BD, bipolar disorder; CN, controls; HR, high risk; L, left; R, right.

