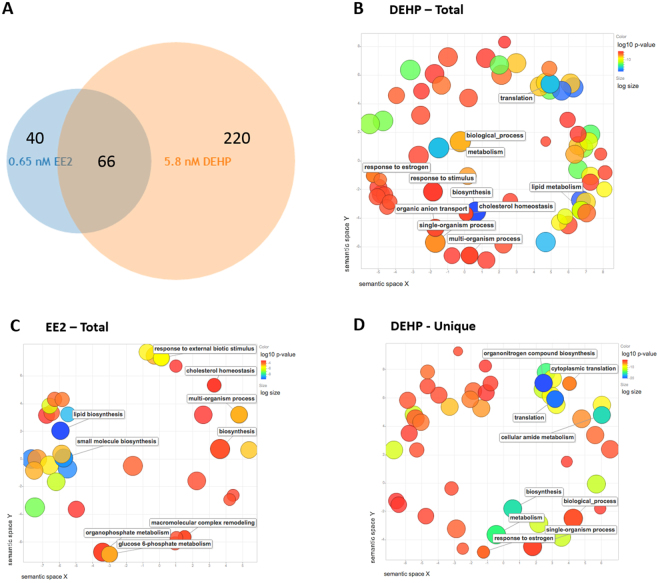
Figure 3.
Functional Analyses RNA-Seq data. (A) Overlap of the significant DE expressed liver transcripts (FDR < 0.4) from 5.8 nM DEHP and 0.65 nM EE2 exposed adult male zebrafish relative to control fish as determined by DESeq. 2. (B–D) Gene Ontology Biological Process analyses: Scatterplots shows the cluster representatives (i.e. terms remaining after the redundancy reduction) in a two dimensional space derived by applying multidimensional scaling to a matrix of the GO terms’ semantic similarities. Bubble color indicates the p-value (legend in upper right-hand corner); size indicates the frequency of the GO term in the underlying GOA database (bubbles of more general terms are larger). GO BP analysis of DE genes in (B) DEHP and (C) EE2 exposed livers. (D) GO BP analysis of DE genes unique to DEHP (not DE in EE2 exposed).

