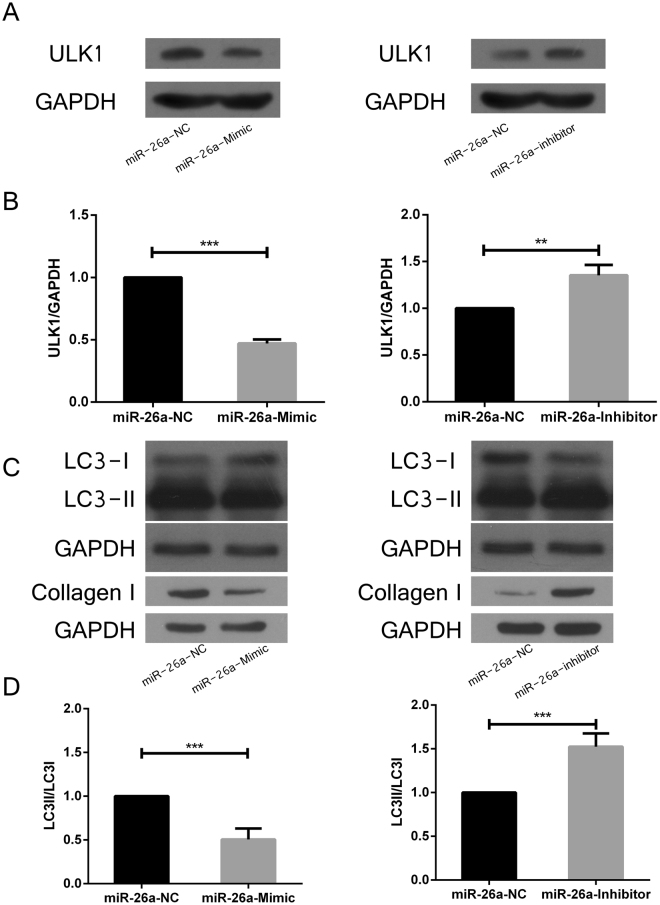
Figure 4.
Effects of miR-26a-5p on the expression level of ULK1, Collagen I and LC3 protein. Western blot analysis of the expression level of ULK1 protein after transfection of miR-26a-5p mimic (A) or inhibitors (B) into cardiac fibroblasts. The expression level of collagen I and the activation of LC3-I to LC3-II level after transfection of miR-26a-5p mimic or inhibitors (C,D) into cardiac fibroblasts (*P < 0.05) compared with NC group.

