
Figure 1.
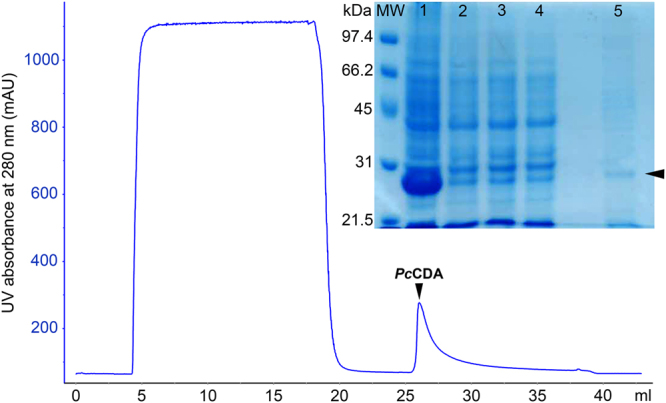
Affinity chromatography purification of PcCDA catalytic domain. (A) Elution profile monitored by absorbance at 280 nm. (B) SDS PAGE analysis of fractions: Lane 1, sample after refolding by dialysis. Lanes 2 and 3, sample after centrifugation and filtered (0.45 μm) loaded into the column. Lane 4, flow-through from the column. Lane 5, eluted fraction with 2.5 mM d-Desthiobiotin after concentration by ultrafiltration. Arrow indicates column elution using d-Desthiobiotin. Arrowhead points to bands with the expected size (26.8 kDa) for PcCDA catalytic domain.