Figure 6.
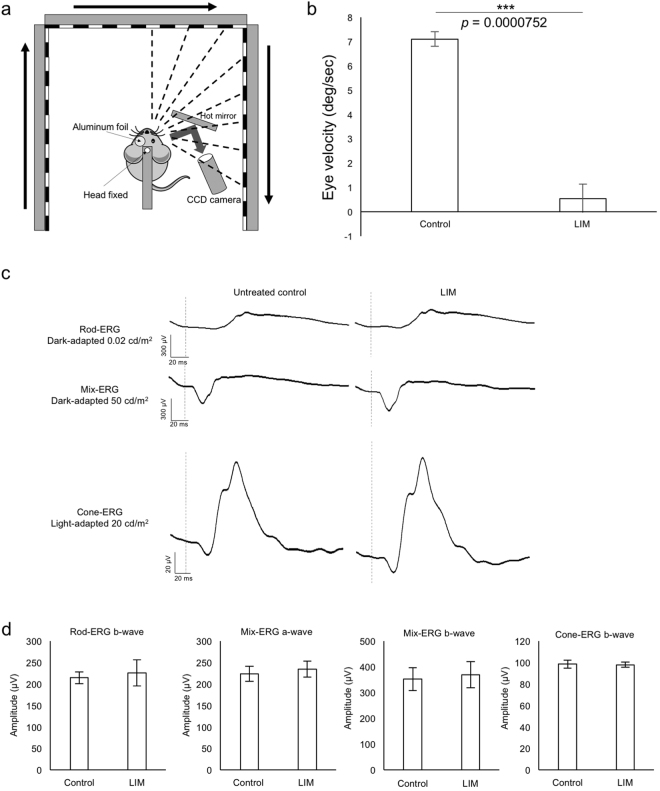
Decreased visual acuity in the mouse LIM model. (a) Schematic view of the OKR system. The images of the right or left eyes are captured by a CCD camera placed on the same side. During the measurement, the contralateral eyes are covered with aluminum foil. Visual stimulation is presented on three LCD monitors around the mouse whose head is fixed in the middle. The schematic view is drawn referred to the paper by Tabata H et al.33. (b) Eye velocities of control and myopic eyes (n = 3). Note that very little response can be detected on myopic eyes. (c) Representative waves of rod, mix, and cone ERG from control eyes and contralateral myopic eyes treated with −30 D lens for 3 weeks. (d) No significant difference is found in amplitude of each ERG condition (n = 3). ***p < 0.001, Error bars indicate mean ± s.d.

