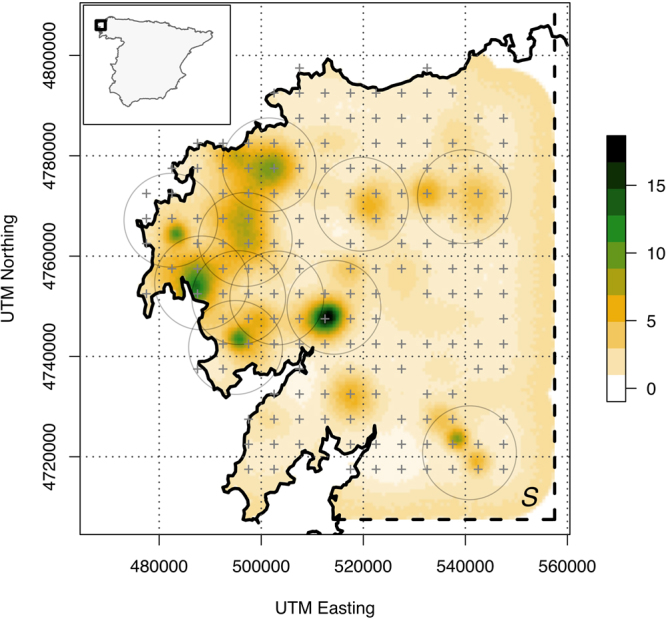
Figure 1.

Posterior mean density of activity centres for wolves in the study area. The spatial locations of detectors are denoted by “+” (grey). S: state space. We included the approximate location of reproductive pack territories (grey circles) by creating a conservative buffer area centred on the rendezvous sites of known breeding packs in 201348. The selection of the size of the circles was based on previous information on the mean and SD of wolf home range sizes of subadult/adult wolves belonging to packs in NW Iberia (122.1 ± 93.6 km2)52 (the area was equal to the mean plus SD = 215 km2). The figure was produced by José Jiménez using R55.
