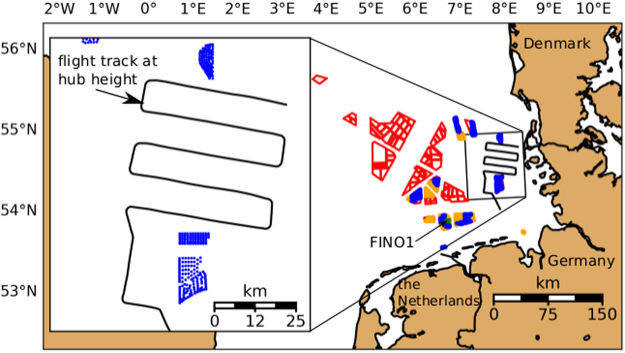
Figure 1.
Distribution of offshore wind farms in the German Bight. Blue regions are farms currently in operation and orange regions are those wind farms that are under construction or have been approved (as of 2017). Red polygons indicate farms with a submitted application (as of 2016). The plot on the left side indicates the flight track of Flight 7 on September 10, 2016. The blue dots represent the location of the individual wind turbines.

