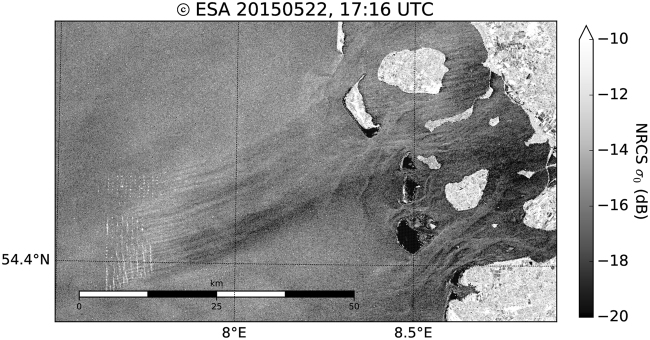
Figure 2.
Example of a SENTINEL-1A satellite SAR image (Copernicus Sentinel data [2015]) acquired over the North Frisian Coast in the German Bight on May 22, 2015 at 17:16 UTC with westerly winds created by Matplotlib37. The white dots on the lower left are radar signatures from windfarm turbines of the three wind parks Amrumbank West, Nordsee Ost and Meerwind Süd/Ost. A wake of reduced wind speed generated by the wind turbines is indicated by darker streaks downwind of the wind farms.

