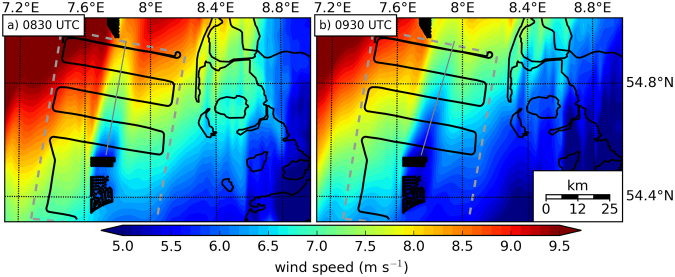
Figure 6.
(a) WRF model simulation of the wind field at hub height (90 m) for 10 September 2016 08:30 UTC. (b) WRF model simulation for 09:30 UTC on the same day. The flight pattern over the German Bight is marked by the black line, the measurement flight domain according to Fig. 5a)–c) by grey dashed line, German and Danish coast by black lines and wind turbines by black dots. Grey line indicates a cross-section of the wind speed, which is displayed in Fig. 7. The figures were generated with Matplotlib37.

