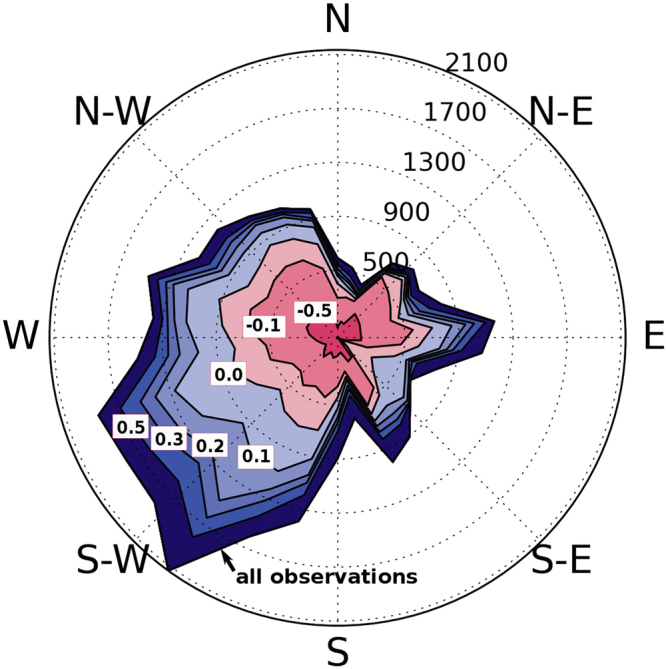
Figure 8.

Stability wind rose indicating the frequency (number of 10-min intervals per 12° wind direction sector) of atmospheric stability. Lines are labelled in terms of the stability measure z/L, where z is the height above ground, and L is the Monin-Obukhov length. Blue and red shading indicates stable and unstable stratification, respectively. The higher the value the stronger the stability. Data are from the FINO 1 offshore platform in the North Sea for the whole year of 2005 at a height of 60 m above the sea surface. Data is available from http://fino.bsh.de/. Only data with wind speeds between the cut-in (5 m s−1) and cut-off (25 m s−1) wind speed have been considered.
