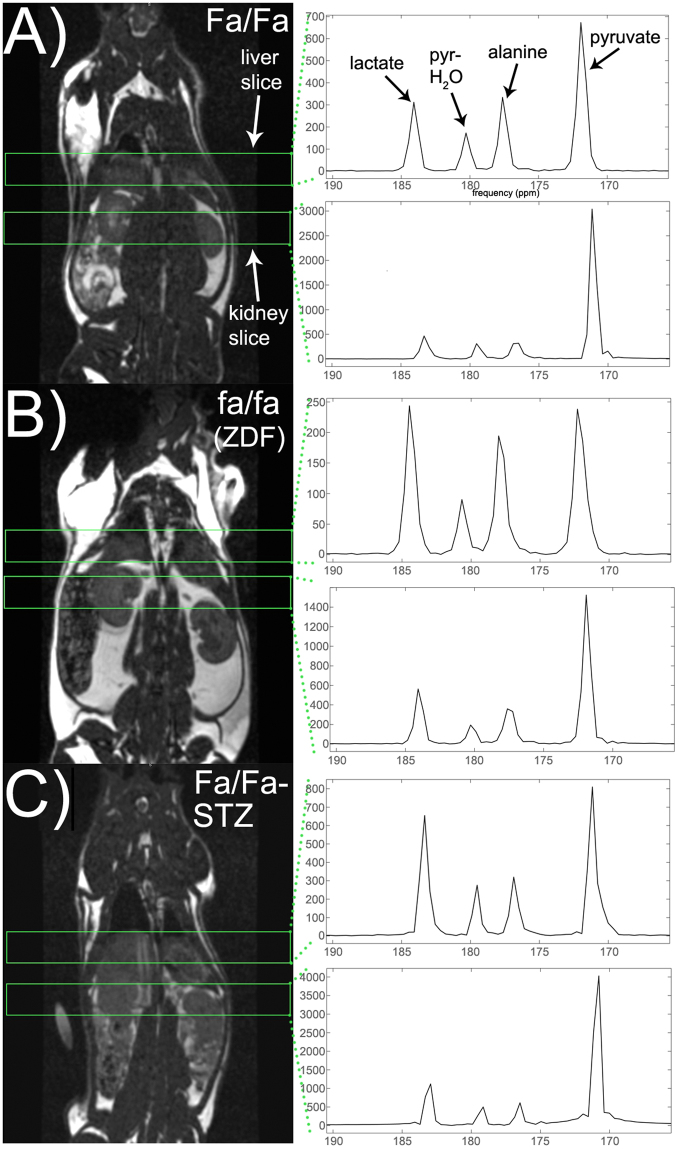
Figure 1.
Localized MR spectra of HP [1-13C]pyruvate from individual Zucker rats sampled from the subgroups described in text: wild type Zucker (Fa/Fa) (A), obese Zucker (fa/fa) (B), and wild type Zucker treated with STZ and subsequent insulin withdrawal for 24–36 h (Fa/Fa-STZ) (C). Resonances corresponding to [1-13C]lactate (184 ppm), [1-13C]pyruvate hydrate (180 ppm), [1-13C]alanine (177 ppm), and [1-13C]pyruvate (172 ppm) are easily identified in all spectra (arrows). HP 13C spectra are shown to the right of standard coronal anatomic 1H MRI images indicating positions of slices for 13C MR data acquisition (green rectangles). In each rat, spectra were acquired from each of two adjacent 12-mm thick axial slices through the liver and kidneys, respectively. MR spectra were summed over all acquisition time points over the 30-second acquisition window, and scaled to the approximate spectral noise level (i.e. the MR data has units of signal-to-noise ratio).

