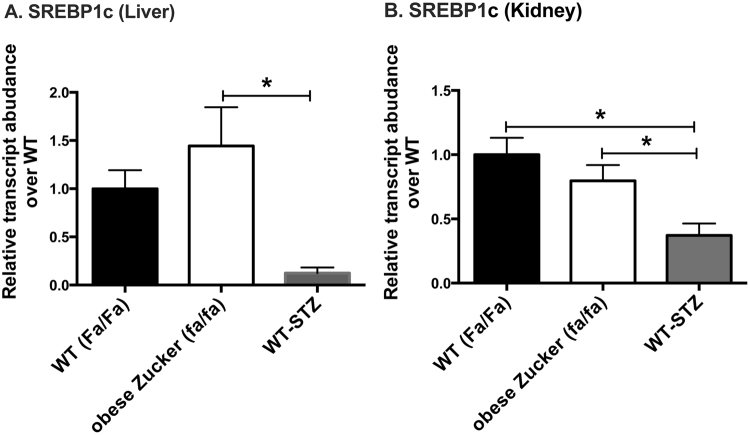
Figure 5.
Hepatic (A) and renal (B) expression levels of SREBP-1c measured using rtPCR. Measurements were obtained in liver and kidney tissue samples from age and sex matched WT (Fa/Fa) (n = 4), obese Zucker (fa/fa) (n = 9), and WT-STZ (n = 6) rats. The fold changes were measured relative to WT (Fa/Fa) controls and calculated by 2−ΔCt method. The data were normalized to β-actin. All data represent mean+/−S.E.M. from three independent experiments. Statistical analysis was performed by one-way ANOVA with Tukey correction for multiple comparisons. (*p < 0.05).

