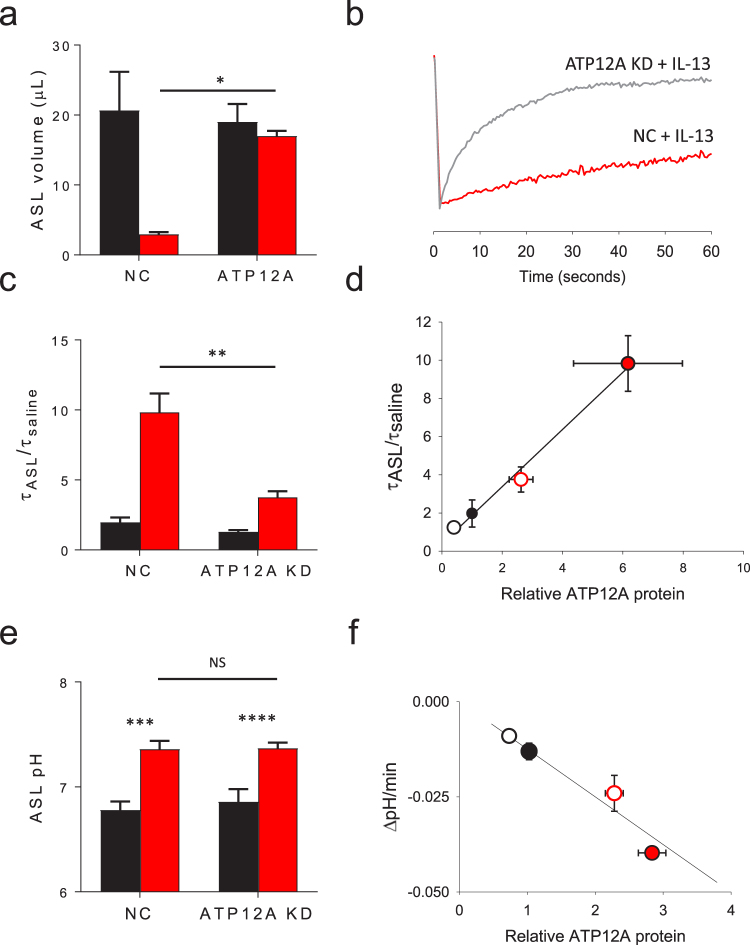
Figure 7.
The IL-13 mediated increases in ASL viscosity are ATP12A dependent. Primary HBE cell cultures were transduced with lentivirus expressing shRNA directed towards ATP12A. IL-13 was added to basolateral culture media 3–5 days prior to evaluation. Control conditions are represented in black, IL-13 treated conditions are represented in red. (a+b) Fluorescent labeled non-absorbable dextran was added to the apical HBE surface. FRAP was measured the following day as a marker of ASL viscosity. (a) ASL meniscus volume is unaffected IL-13 when ATP12A is not expressed. Data shown is mean ASL meniscus volume ± SEM. *p < 0.001 by unpaired Student’s t-test, n = 3 tissue donors, each with 4–6 experimental replicates. (b) Representative FRAP signal recovery tracings for IL-13 treated ATP12A KD and empty vector controls (NC). (c) Lack of ATP12A expression is protective against IL-13 mediated increases in ASL viscosity as measured by FRAP. Data shown is average τASL/τsaline ± SEM in primary HBE cells with and without lentiviral shRNA ATP12A knockdown ± IL-13, n = 12 replicates from three tissue donors, **p = 0.0003 via unpaired Student’s t-test. (d) The increase in ASL viscosity is directly proportional to the level of ATP12A protein expression. Open circles represent ATP12A knockdown cultures and IL-13 treated cultures are shown in red. Data shown is mean τASL/τsaline ± SEM (vertical error bars) and mean relative ATP12A protein expression ± SEM (horizontal error bars). Data represents 9 replicates from 3 tissue donors (R2 = 0.99, P = 0.0047). (e) ASL pH is not changed by lack of ATP12A expression. Data shown is mean ASL pH ± SEM, n = 9 replicates from 2 tissue donors, ***p = 0.0001 and ****p = 0.0014 by unpaired Student’s t-test. (f) The rate of ASL acidification is proportional to the degree of ATP12A expression. Open circles represent ATP12A knockdown cultures and IL-13 treated cultures are shown in red. Data shown is mean rate of ASL pH change ± SEM (ΔpH/min, vertical error bars) and mean relative ATP12A protein expression ± SEM (horizontal error bars), data represents 6 replicates from 2 tissue donors, R2 = 0.74, p < 0.05.

