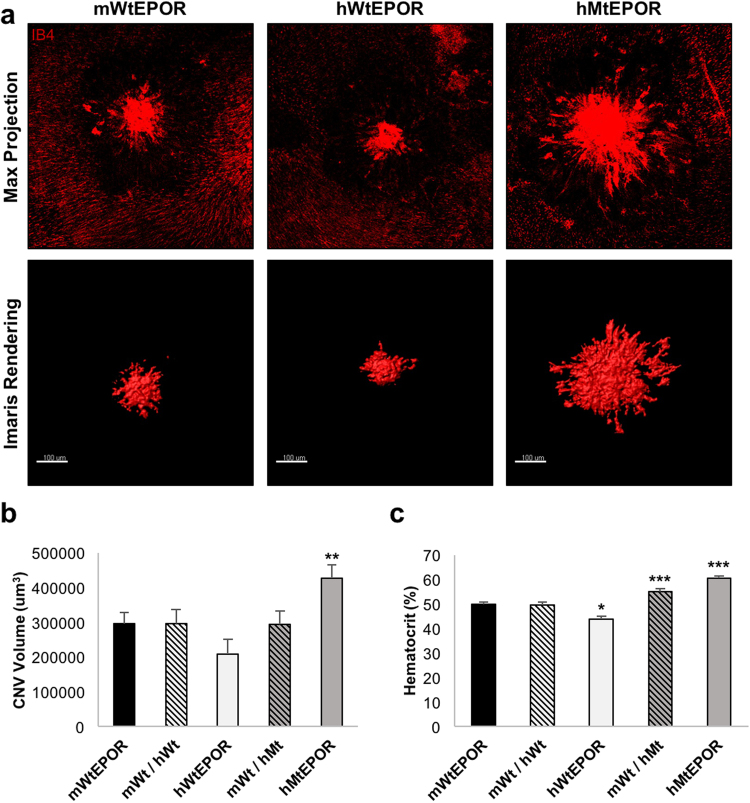
Figure 2.
Effect of altered EPOR signaling on laser-induced choroidal neovascularization. (a) Representative images of individual lesions from mWtEPOR, hWtEPOR, and hMtEPOR mice seven days after laser treatment. Flatmounts were stained with IB4 and Z-stacks were captured at 20× and then rendered using the surfaces surpass feature in IMARIS to calculate volume. Both confocal maximum projections and the IMARIS 3-D surface rendering are provided for comparison. (b) Comparison of CNV volumes in mWtEPOR mice and human EPOR knock-in mice seven days after laser treatment (n > 50 spots for each treatment group). (c) Comparison of hematocrit levels in mWtEPOR mice and human EPOR knock-in mice (n ≥ 20 mice for each treatment group). Results are means ± SEM. *p < 0.05, **p < 0.01, ***p < 0.001 relative to mWtEPOR.

