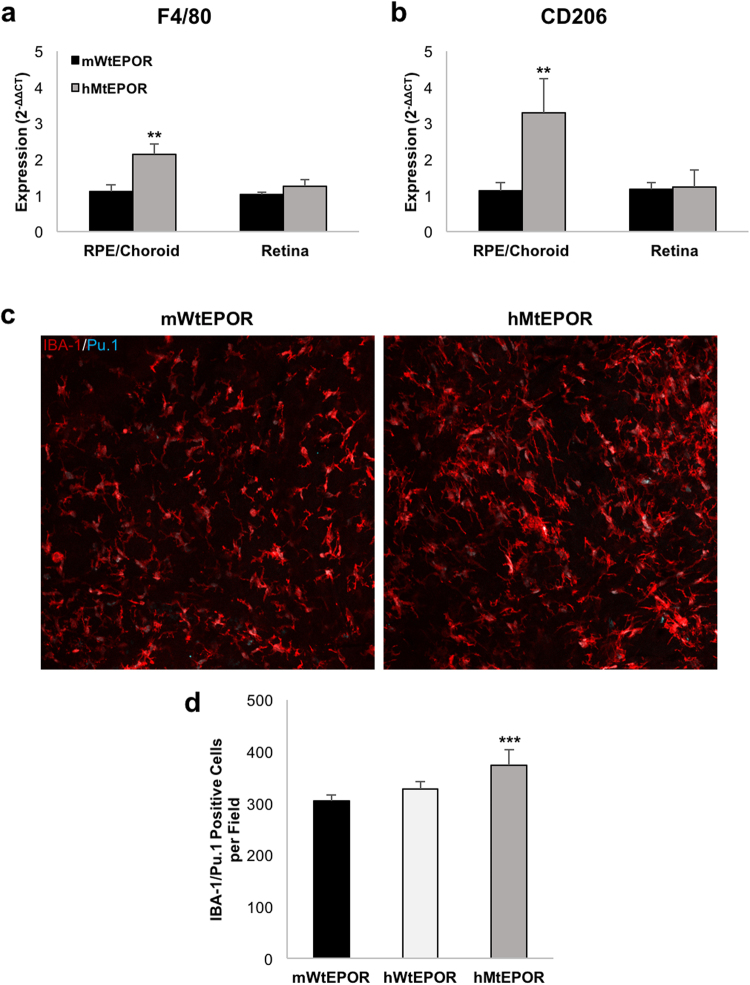
Figure 3.
Effect of increased EPOR signaling on macrophage markers in ocular tissue. (a) and (b) mRNA expression levels of macrophage markers (a) F4/80 and (b) CD206 in the RPE/choroids and retina of non-treated mWtEPOR and hMtEPOR mice (n ≥ 6 animals per treatment group). (c) Representative images of IBA-1/Pu.1 positive cells in choroidal tissue from mWtEPOR and hMtEPOR mice. (d) Comparison of the number of IBA-1/Pu.1 cells per image (n = 8–16 images per genotype). Results are means ± SEM. **p < 0.01, ***p < 0.001 relative to mWtEPOR non-treated control.

