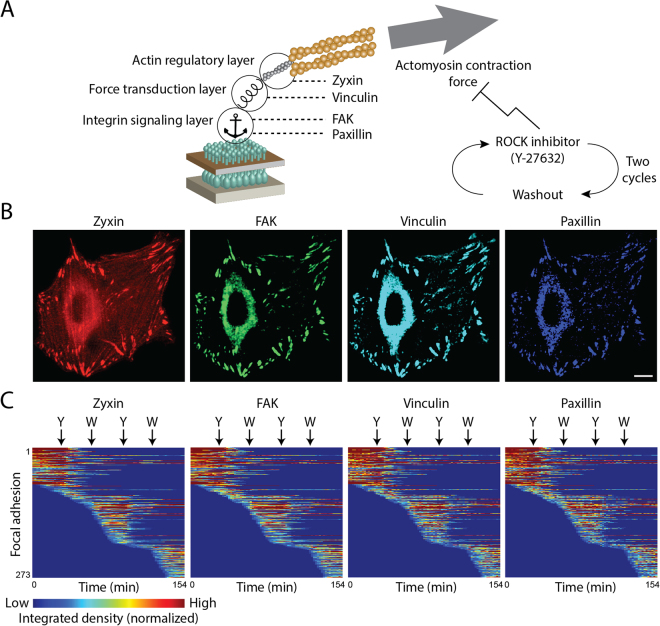
Figure 1.
Four-color live cell imaging of focal adhesions responding to ROCK perturbations. (A) A scheme indicating the four examined components and their vertical positions within the focal adhesion28. Inhibition and recovery of actomyosin contractility were achieved by the addition and washout of the ROCK inhibitor Y-27632, respectively. (B) Images of a cell expressing TDmKate2-zyxin, mCitrine-FAK, TDmTFP-vinculin and TDmTagBFP-paxillin before the perturbations. Scale bar, 10 μm. (C) Heatmaps show the integrated density of zyxin, FAK, vinculin and paxillin in each of the tracked focal adhesions of one cell as a function of time. Corresponding rows in the four heatmaps relate to the same focal adhesion. Arrows indicate the time of Y-27632 (Y) additions and washouts (W). The anchor image was obtained from Wikimedia Commons.

