Figure 2.
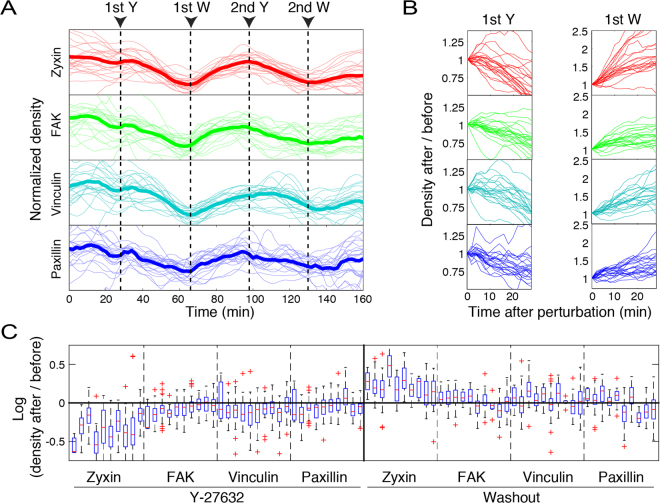
Diverse response extents of focal adhesion components upon ROCK perturbations. (A) The densities of zyxin, FAK, vinculin and paxillin in single focal adhesions of one cell are shown as a function of time along the experiment. Only focal adhesions that existed throughout the whole imaging period are shown. Each trace was normalized by dividing its values by their mean. Thick lines denote the traces average (n = 22 focal adhesions) at each time point. Arrows indicate the time points of Y-27632 additions (Y) and washouts (W). (B) The density changes of the same focal adhesions shown in (A), partitioned to the time periods following each perturbation. The intensity values of each trace segment were divided by its first value, to illustrate the fold change in density. (C) Box plots of the response extents of zyxin, FAK, vinculin and paxillin upon each perturbation in the focal adhesions of each of the ten analyzed cells (ten box plots within each dashed-line partition). The “before” and “after” density values were averaged along 3 sequential time frames before the perturbation and at 24 minutes after the perturbation, respectively. In the box plots, boxes indicate the interquartile range (IQR) between the first and third quartiles and the line within indicates the median. Whiskers denote the lowest and highest values within 1.5IQR from the first and third quartiles, respectively. Crosses indicate data points beyond the whiskers.

