Figure 3.
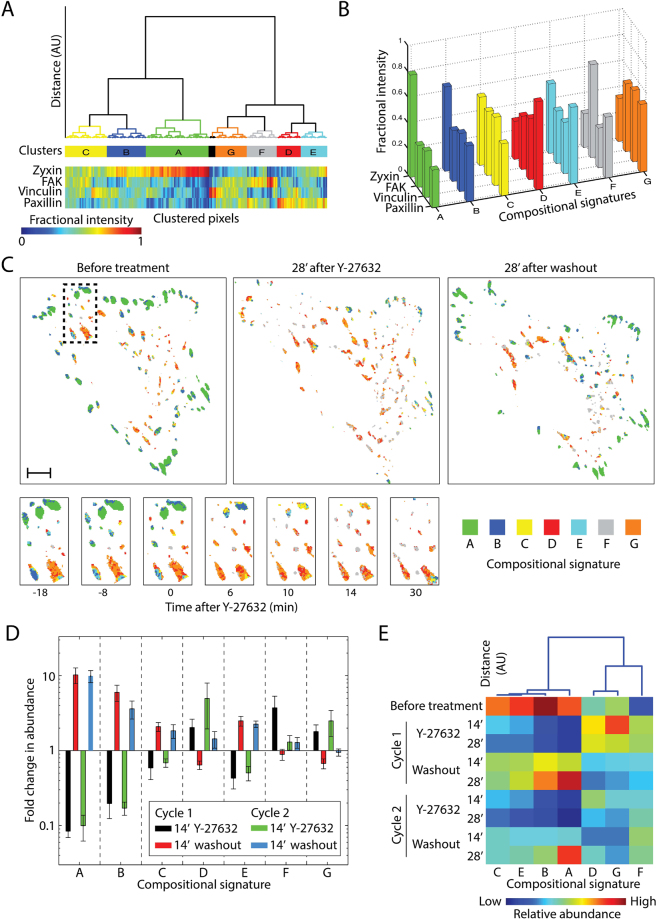
Compositional imaging analysis of focal adhesions upon ROCK perturbations. (A) Pixels of the 4-color live cell imaging of 5 cells clustered according to the fractional intensities of zyxin, FAK, vinculin and paxillin. (B) Bar plots presenting the average fractional intensity for each component in each cluster, defining the compositional signatures. (C) Compositional images of a cell (top) and of the marked (dashed line) region within it magnified (bottom) before and after the first Y-27632 addition. Pixels are colored according to their compositional signatures color-code, as shown in (B). Scale bar, 10 μm. (D) Bar plots showing the mean of the fold change (14 minutes after perturbation/before perturbation) in the number of pixels (abundance) assigned to each compositional signature (n = 5 cells, error bars indicate standard error of the mean). (E) The compositional signatures clustered based on their abundance profile after the various perturbations. The heatmap shows the mean abundance of each composition at the indicated time points after ROCK perturbations (n = 5 cells). The columns of the heatmap are ordered according to the hierarchical clustering dendrogram shown on top.

